Return to the Disaster Data Pathfinder
Image

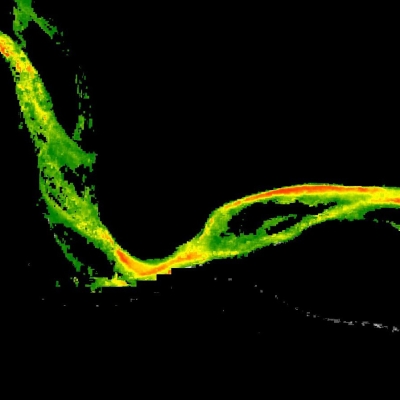
The products from the joint NASA/Japan Aerospace Exploration Agency (JAXA) Tropical Rainfall Measuring Mission (TRMM) and the Global Precipitation Measurement (GPM) Mission are available individually and also have been integrated with data from a global constellation of satellites to yield improved spatial/temporal precipitation estimates providing precipitation data in 30 minutes (in the case of GPM). The integrated products are the TRMM Multi-satellite Precipitation Analysis (TMPA) and the Integrated Multi-satellite Retrievals for GPM (IMERG). IMERG's multiple runs accommodate different user requirements for latency and accuracy (Early = 4 hours, e.g., for flash flood events; Late = 12 hours, e.g., for crop forecasting; and Final = 3 months, with the incorporation of rain gauge data, for research).
Research-quality data products can be accessed using Earthdata Search:
- TMPA
Rainfall estimate at 3 hours, 1 day, or near real-time (NRT) and accumulated rainfall at 3 hours and 1 day. Data are in HDF format, and can be opened using the NASA Panoply data viewer. Data are available from 1997. - IMERG
Early, Late, and Final precipitation data on the half-hour or 1-day timeframe. Data are in NetCDF or HDF format, and can be opened using Panoply. Data are available from 2000.
Data products can be visualized as a time-averaged map, an animation, seasonal maps, scatter plots, or a time series through an online interactive tool called Giovanni. Follow these steps to plot data in Giovanni: 1) Select a map plot type. 2) Select a date range. Data are in multiple temporal resolutions and multiple temporal coverages, so be sure to note the start and end date to ensure you access the desired dataset. 3) Check the box of the variable in the left column that you would like to include and then plot the data. For more information on choosing a type of plot, see the Giovanni User Manual.
Data can be visualized using the NASA Worldview satellite imagery exploration tool:
- IMERG Precipitation Rate
- AMSR2 Precipitation Rate
The Advanced Microwave Scanning Radiometer 2 (AMSR2) instrument collects data that indicate the rate at which precipitation is falling on the surface of the ocean and is measured in millimeters per hour (mm/hr). - NLDAS Precipitation Total
- GLDAS Precipitation Total (data only available through 2010)
The NLDAS monthly Precipitation Total data are generated through temporal accumulation of the hourly datal; the GLDAS monthly data are generated through temporal averaging of the 3-hourly data. The data are in units of "kg/m2/s," which is equivalent to "mm/s."
The NRT "early run" product at NASA's Global Precipitation Measurement website is generated every half hour with a 6-hour latency from the time of data acquisition:
Daymet is a collection of gridded estimates of daily weather parameters and is modeled on daily meteorological observations. Weather parameters in Daymet include daily minimum and maximum temperature, precipitation, vapor pressure, radiation, snow water equivalent, and day length at 1 km resolution over North America, Puerto Rico, and Hawaii.
Daymet data can be retrieved in a variety of ways, including Earthdata Search, an application programming interface (API), tools developed by NASA's Oak Ridge National Laboratory Distributed Active Archive Center (ORNL DAAC), and through NASA's Land Processes DAAC (LP DAAC) Application for Extracting and Exploring Analysis Ready Samples (AppEEARS) tool.
The NASA Earth Exchange Global Daily Downscaled Projections (NEX-GDDP) dataset is comprised of high-resolution, bias-corrected global downscaled climate projections derived from the General Circulation Model (GCM) runs conducted under the Coupled Model Intercomparison Project Phase 6 (CMIP6) and across all four “Tier 1” greenhouse gas emissions scenarios known as Shared Socioeconomic Pathways (SSPs).
This dataset provides a set of global, high resolution, bias-corrected climate change projections that can be used to evaluate climate change impacts on processes that are sensitive to finer-scale climate gradients and the effects of local topography on climate conditions. Uses include: air temperature, precipitation volume, humidity, stellar radiation, and atmospheric wind speed.
NEX-GDDP-CMIP6 data are available through the NASA Center for Climate Simulation (NCCS):
Image

One important ingredient for tropical storm formation is high relative humidity values from the ocean surface to the mid-levels of the atmosphere. As this warm, humid air rises, it creates extensive areas of clouds, precipitation, and embedded thunderstorms.
Research-quality data products can be accessed using Earthdata Search:
- AIRS Relative Humidity
AIRS data are daily at 1 degree and the Level 3 data products are provided in either the descending (equatorial crossing north to south at 1:30 a.m. mean local time) or ascending (equatorial crossing south to north at 1:30 p.m. mean local time) orbit. Note that the data were acquired only until 2016. - MERRA-2 Humidity
There are several options available: 1-hourly, 3-hourly, 6-hourly. These options provide information on surface specific humidity, specific humidity at 2 m, and relative humidity.
Data products can be visualized as a time-averaged map, an animation, seasonal maps, scatter plots, or a time series through an online interactive tool called Giovanni. Follow these steps to plot data in Giovanni: 1) Select a map plot type. 2) Select a date range. Data are in multiple temporal resolutions, so be sure to note the start and end date to ensure you access the desired dataset. 3) Check the box of the variable in the left column that you would like to include and then plot the data. For more information on choosing a type of plot, see the Giovanni User Manual.
The NASA Prediction of Worldwide Energy Resources (POWER) Data Access Viewer provides solar and meteorological datasets through a responsive web mapping application with the capability for data subsetting, charting, and visualization. The data are GIS-ready.
The NASA Earth Exchange Global Daily Downscaled Projections (NEX-GDDP) dataset is comprised of high-resolution, bias-corrected global downscaled climate projections derived from the General Circulation Model (GCM) runs conducted under the Coupled Model Intercomparison Project Phase 6 (CMIP6) and across all four “Tier 1” greenhouse gas emissions scenarios known as Shared Socioeconomic Pathways (SSPs).
This dataset provides a set of global, high resolution, bias-corrected climate change projections that can be used to evaluate climate change impacts on processes that are sensitive to finer-scale climate gradients and the effects of local topography on climate conditions. Uses include: air temperature, precipitation volume, humidity, stellar radiation, and atmospheric wind speed.
NEX-GDDP-CMIP6 data are available through the NASA Center for Climate Simulation (NCCS):
Image

While heat energy is stored and mixed throughout the depth of the ocean, the temperature of water at the ocean surface plays a significant role in weather and is a driving force for cyclonic storms. Where the sea surface temperature (SST) is high, relatively large amounts of heat energy and moisture enter the atmosphere, sometimes producing intense storms.
Research-quality data products from the Moderate Resolution Imaging Spectroradiometer (MODIS) aboard NASA's Terra and Aqua satellites and the Visible Infrared Imaging Radiometer Suite (VIIRS) aboard the joint NASA/NOAA Suomi National Polar-orbiting Partnership (Suomi NPP) satellite can be accessed using Earthdata Search:
Data products can be visualized as a time-averaged map, an animation, seasonal maps, scatter plots, or a time series through an online interactive tool called Giovanni. Follow these steps to plot data in Giovanni: 1) Select a map plot type. 2) Select a date range. Data are in multiple temporal resolutions and multiple temporal coverages, so be sure to note the start and end date to ensure you access the desired dataset. 3) Check the box of the variable in the left column that you would like to include and then plot the data. For more information on choosing a type of plot, see the Giovanni User Manual.
- Aqua MODIS SST data
Data products from MODIS on the Aqua satellite at 4 km resolution are provided at both 8-day and monthly temporal resolutions.
A Group for High Resolution Sea Surface Temperature (GHRSST) Level 4 sea surface temperature analysis dataset, the Multi-Scale Ultra High Resolution Sea Surface Temperature (MUR SST), is now available from June 2002 to present at 1 km spatial resolution. The dataset is based upon nighttime skin and sub-skin observations from several instruments, including satellite and in situ observations.
Image

NASA’s Cyclone Global Navigation Satellite System (CYGNSS) consists of a constellation of satellites that collect frequent measurements of surface wind speeds in the inner core of tropical cyclones. The satellites use the constant and ubiquitous signals from the Global Positioning Satellite (GPS) system. The Modern-Era Retrospective analysis for Research and Applications, Version 2 (MERRA-2) provides surface wind data beginning in 1980 and runs a few weeks behind real time.
Research-quality CYGNSS and MERRA-2 data products can be accessed using Earthdata Search:
- CYGNSS Wind
Average wind speed (m/s) and mean square slope (MSS) - MERRA-2 Eastern and Northward Wind
Wind measurements are in meters per second; the file is available as a netCDF and can be opened using NASA's Panoply data viewer. Note that sea level pressure is also available within this same file.
Data products can be visualized as a time-averaged map, an animation, seasonal maps, scatter plots, or a time series through an online interactive tool called Giovanni. Follow these steps to plot data in Giovanni: 1) Select a map plot type. 2) Select a date range. Data are in multiple temporal resolutions and multiple temporal coverages, so be sure to note the start and end date to ensure you access the desired dataset. 3) Check the box of the variable in the left column that you would like to include and then plot the data. For more information on choosing a type of plot, see the Giovanni User Manual.
Data can be visualized using the NASA Worldview satellite imagery exploration tool:
The NASA Earth Exchange Global Daily Downscaled Projections (NEX-GDDP) dataset is comprised of high-resolution, bias-corrected global downscaled climate projections derived from the General Circulation Model (GCM) runs conducted under the Coupled Model Intercomparison Project Phase 6 (CMIP6) and across all four “Tier 1” greenhouse gas emissions scenarios known as Shared Socioeconomic Pathways (SSPs).
This dataset provides a set of global, high resolution, bias-corrected climate change projections that can be used to evaluate climate change impacts on processes that are sensitive to finer-scale climate gradients and the effects of local topography on climate conditions. Uses include: air temperature, precipitation volume, humidity, stellar radiation, and atmospheric wind speed.
NEX-GDDP-CMIP6 data are available through the NASA Center for Climate Simulation (NCCS):
Image

Research-quality data products can be accessed using Earthdata Search:
- MERRA-2 Sea Level Pressure
Sea level pressure is in Pascal; the file is available in NetCDF format, and can be opened using the NASA Panoply data viewer. Note that eastward wind and northward winds are also available within this same file.
Data products can be visualized as a time-averaged map, an animation, seasonal maps, scatter plots, or a time series through an online interactive tool called Giovanni. Follow these steps to plot data in Giovanni: 1) Select a map plot type. 2) Select a date range. Data are in multiple temporal resolutions and multiple temporal coverages, so be sure to note the start and end date to ensure you access the desired dataset. 3) Check the box of the variable in the left column that you would like to include and then plot the data. For more information on choosing a type of plot, see the Giovanni User Manual.
Image

NASA's Socioeconomic Data and Applications Center (SEDAC) provides a number of datasets on population exposure and vulnerability and flood hazard potential:
- Population Density from Earthdata Search
- Flood-related socioeconomic data from Earthdata Search
- Global Man-made Impervious Surface (GMIS) data from Earthdata Search
- Population Density in Worldview
- Flood-related socioeconomic data in Worldview
SEDAC also has several tools for visualizing population data, like the POPGRID Viewer that enables direct comparison of different population datasets and the Hazards Mapper web mapping application that allows users to estimate the number of people in proximity to a natural disaster and to assess exposure.
The State of the Ocean (SOTO), available through NASA's Physical Oceanography Distributed Active Archive Center (PO.DAAC), is an interactive web-based tool to generate informative maps, animations, and plots that communicate and promote the discovery and analysis of the state of the oceans. The tool includes data such as sea surface temperature, surface winds, surface currents, sea surface height, soil moisture, and precipitation.
Image
 is an interactive web-based tool to generate informative maps, animations, and plots that communicate and prove the discovery and analysis of the state of the oceans.")
Image
")
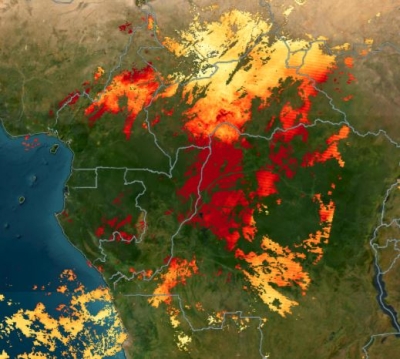
Clouds
The joint NASA/NOAA Geostationary Operational Environmental Satellite (GOES)-East satellite is centered on 75.2 degrees W, covering the Conterminous U.S., Canada, Central America, and South America (along with most of the Atlantic Ocean). The joint NASA/NOAA GOES-West satellite is centered on 137.2 degrees W, covering most of the Pacific Ocean, the U.S., most of Canada, Central America, the western half of South America, and parts of Australasia. The Japan Meteorological Agency Himawari-8 satellite is centered on 140.7 degrees E, covering most of the Pacific Ocean, a portion of Eastern Asia, and parts of Australasia. The data from the red visible layer is used primarily to monitor the evolution of clouds throughout the daylight hours. It is also useful for identifying small-scale features such as river fog/clear air boundaries, or overshooting tops of cumulus clouds. Data are acquired every 10 minutes or more often for mesoscale sectors, with time steps as small as 30 seconds if two mesoscale sectors are overlaid.
GOES and Himiawari-8 imagery can be interactively explored using the NASA Worldview satellite imagery exploration tool:
Cloud Top Temperatures
Infrared light can be used to determine the temperatures of clouds and thunderstorms that make up tropical cyclones. The stronger the storms are, the higher they extend into the troposphere, which results in cold cloud-top temperatures.
- MODIS Cloud Top Temperature Imagery in NASA Worldview
Precipitation
- IMERG Precipitation Rate in Worldview
- IMERG Early Run Half-Hourly at NASA's Global Precipitation Measurement website
The IMERG "early run" product is generated every half hour with a 6-hour latency from the time of data acquisition.
Image
 tool. Credit: NASA")
Relative Humidity
- AIRS Surface Relative Humidity Imagery in NASA Worldview
Sea Surface Temperature (SST)
- Aqua and Terra MODIS SST Imagery in NASA Worldview
- Suomi NPP VIIRS SST Imagery in NASA Worldview
- MUR SST Imagery in NASA Worldview
- MUR SST temperature anomalies Imagery in NASA Worldview
SST anomalies are created by computing the difference between daily MUR SST and daily MUR SST climatology (12-year average, 2003-2014).
Surface Reflectance
- MODIS Corrected Reflectance Imagery in NASA Worldview
The MODIS Corrected Reflectance imagery is available only as near real-time imagery. The MODIS Corrected Reflectance algorithm uses MODIS Level 1B data (the calibrated, geolocated radiances). It is not a standard, research-quality product. The purpose of this algorithm is to provide natural-looking images by removing gross atmospheric effects, such as Rayleigh scattering, from MODIS visible bands 1-7. - VIIRS Corrected Reflectance Imagery in NASA Worldview
The VIIRS Corrected Reflectance imagery is available only as near real-time imagery.
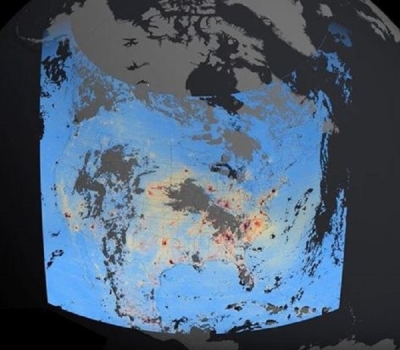
Weather Maps
Image

NASA's Global Modeling and Assimilation Office (GMAO) Goddard Earth Observing System, Version 5 (GEOS-5) model has a series of weather maps that can be used to predict parameters such as precipitation, humidity, wind speed, and temperature up to 240 hours out.
- GEOS-5 Weather Maps
Within the viewer, select the parameter or field of interest, the area of interest, and indicate the forecast time and the forecast lead hour. Selecting “Animate” shows the forecast for the given parameter over the time period indicated. Note that it may take time to load the images to animate. For wind speed near the surface, select 850 as your level (note; 850 hPa is approximately 5,000 ft/1,500 m above sea level).
NASA Earth Applied Sciences Disasters program area Tropical Cyclone Dashboard
The dashboard contains experimental NASA products that may assist in preparing for or responding to a tropical cyclone. Datasets include precipitation, sea surface temperature, radar reflectivity, flood detection, soil moisture, and wind speed.
- Tropical Cyclone Dashboard
- NRT Cyclone Products from NASA's Disasters program
- Event Response StoryMaps
Observing Tropical Storms using NASA GIS Data
NASA's near real-time GIS Tropical Storms Web App and StoryMap provide access to data layers that allow you to study many facets of tropical cyclones including current precipitation from the Integrated Multi-Satellite Retrieval for Global Precipitation Measurement (IMERG) Early Run, global sea surface temperature, and the track of recent hurricanes, cyclones, and typhoons. An interactive companion, the Tropical Storms Web Map, also is available.
Image

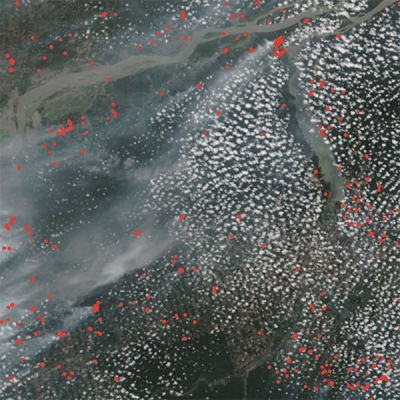
NASA has several products that can be used to assess flooding qualitatively created from data acquired by sensors aboard the MODIS sensors aboard NASA's Terra and Aqua satellites, VIIRS aboard the joint NASA/NOAA Suomi NPP and GOES-20 satellites, and the joint NASA/USGS Landsat series of satellites. However, cloud cover and nighttime conditions can impede data collection by these sensors. During a storm, this is a significant drawback. Once a storm has passed, pre-event and post-event imagery can provide a quantitative assessment of flooding extent and other damage.
During a storm, Synthetic Aperture Radar (SAR) may provide a better “view,” as it is able to penetrate cloud cover and works in both day and night conditions. SAR data are more complex, requiring a certain level of processing skill. Refer to the Tools for Data Access and Visualization section for information on processing Sentinel SAR data.
Image
 Surface reflectivity observations for the time period Jul 1–Aug 20, 2017, before the hurricane season began. (b) Surface reflectivity observations after Hurricane Harvey (Aug 25–Sep 15, 2017) for the southeastern United States. Observations in the inset of Cuba were recorded in the time period after Hurricane Irma (Sep 8–Sep 30, 2017). (c) Observed change in surface reflectivity after Hurricanes Harvey (s")
NASA's Cyclone Global Navigation Satellite System (CYGNSS) mission is responsive to reflections from standing water and the amount of moisture in the soil, showing promise for mapping flood inundation. Currently flood inundation maps have to be derived from the Delay-Doppler Maps (DDMs) found in the Level 1 datasets. Information on how these data can be used to produce flood inundation maps can be found in research papers, like CYGNSS data map flood inundation during the 2017 Atlantic hurricane season.
Research-quality data products can be accessed using Earthdata Search or through NASA partner websites:
- MODIS Surface Reflectance from Earthdata Search
- VIIRS Surface Reflectance from Earthdata Search
Note that a false-color image created by combining bands M11 as red, I2 as green, and I1 as blue is useful for enhancing flood conditions. In a false-color image made with this band combination, liquid water on the ground appears very dark since it absorbs in the red and the shortwave-infrared ranges. To only choose those bands, see the customization option within Earthdata in the Tools for Data Access and Visualization section. - Landsat Data from USGS Earth Explorer
Landsat is a joint NASA/USGS program that provides the longest continuous space-based record of Earth’s land. On the USGS Earth Explorer website, specify your search criteria, then:- Select "Data Sets"
- Select Landsat
- Select Landsat Collection 1 Level-1
- Select Landsat 7 and/or Landsat 8
- Sentinel-1A and Sentinel-1B SAR data from Earthdata Search
There are several options when choosing SAR data. Polarization is the direction the signal is transmitted or received. Dual polarization, for example, refers to two different signal directions. Another option for SAR data is the inclusion of phase information. Level 1 data are produced as single look complex (SLC), in which the phase information is preserved, or as ground-range detected (GRD), in which the phase information is lost. Dual polarized GRD is acceptable for flood inundation mapping.
To learn more about SAR, read the Backgrounder What is SAR?; for information about processing Level 1 data, view the ARSET Introduction to SAR training or the NASA Alaska Satellite Facility DAAC (ASF DAAC) flood inundation data recipe for ArcGIS and flood inundation data recipe for QGIS. - Sentinel-1A and Sentinel-1B SAR data from Vertex
Vertex is the ASF DAAC search tool that allows for the preview of numerous types of SAR data, including Sentinel-1. - CYGNSS data from Earthdata Search
Data can be visualized in NASA Worldview (often in near real-time) and through NASA’s experimental Global Flood Mapping and Advanced Rapid Imaging and Analysis (ARIA) projects:
- VIIRS Corrected Reflectance in Worldview
Note that a false-color image created by combining bands M11 as red, I2 as green, and I1 as blue is useful for enhancing flood conditions. In a false-color image made with this band combination, liquid water on the ground appears very dark since it absorbs in the red and the shortwave-infrared ranges. - Event Response to Floods at ARIA
The ARIA Project, a joint effort of the California Institute of Technology and NASA's Jet Propulsion Laboratory, is developing the infrastructure to generate imaging products in near real-time that can improve situational awareness for disaster response.
Image
 satellite before and after the landfall of Hurricane Harvey can be used to monitor changing ground conditions due to Harvey's rainfall.")
NASA's Soil Moisture Active Passive (SMAP) satellite measures the moisture in the top 5 cm of soil globally, every 2–3 days, at a resolution of 9–36 km. NASA, in collaboration with other agencies, has developed models of soil moisture content, incorporating satellite information with ground-based data when available. These models are part of the Land Data Assimilation System (LDAS), of which there is a global collection (GLDAS) and a North American collection (NLDAS). LDAS takes inputs of measurements like precipitation, soil texture, topography, and leaf area index and then uses those inputs to model output estimates of soil moisture and evapotranspiration.
Research-quality data products can be accessed using Earthdata Search; datasets are available in HDF5 format, which are also customizable to GeoTIFF.
ORNL DAAC's Soil Moisture Visualizer integrates ground-based, SMAP, and other soil moisture data into a visualization and data distribution tool. See the Tools for Data Access and Visualization section for additional information.
LP DAAC's AppEEARS offers another option to simply and efficiently extract subsets, transform, and visualize SMAP data products.
Data products can be visualized as a time-averaged map, an animation, seasonal maps, scatter plots, or a time series through an online interactive tool called Giovanni. Follow these steps to plot data in Giovanni: 1) Select a map plot type. 2) Select a date range. Data are in multiple temporal resolutions and multiple temporal coverages, so be sure to note the start and end date to ensure you access the desired dataset. 3) Check the box of the variable in the left column that you would like to include and then plot the data. For more information on choosing a type of plot, see the Giovanni User Manual.
NRT imagery can be accessed using NASA Worldview:
Image

The VIIRS Day/Night Band shows Earth’s surface and atmosphere using a sensor designed to capture low-light emission sources under varying illumination conditions, which provides an assessment of power outages across an area.
Note that the imagery to the right is not showing raw imagery of light. A team of scientists from NASA’s Goddard Space Flight Center and Marshall Space Flight Center processed and corrected the raw data to filter out stray light from the Moon, fires, airglow, and any other sources that are not electric lights. Their processing techniques also remove as much other atmospheric interference as possible.
NASA has also developed the Black Marble, a daily calibrated, corrected, and validated product suite, so nightlight data can be used effectively for scientific observations. Black Marble's standard science processing removes cloud-contaminated pixels and corrects for atmospheric, terrain, vegetation, snow, lunar, and stray light effects on the VIIRS Day/Night Band radiances. Black Marble data can be accessed at NASA's Level-1 and Atmosphere Archive and Distribution System DAAC (LAADS DAAC). Black Marble imagery in NASA Worldview is an image composite that was assembled from clear, cloud free images for 2012 and 2016. Black Marble also provides a Nighttime Blue/Yellow Composite, which is a false color composite created using the VIIRS at-sensor radiance and brightness temperatures from the M15 band.
- Black Marble at LAADS DAAC
- Black Marble Imagery in NASA Worldview
- Black Marble Blue/Yellow Composite imagery in NASA Worldview
For more information on the VIIRS DNB and Black Marble products, read the Nighttime Lights Backgrounder.