Image

NASA's Socioeconomic Data and Applications Center (SEDAC) provides a number of datasets on population exposure, vulnerability and risk, and earthquake hazard potential.
Image
 is a constellation of 30 satellites used for navigation and precise geodetic position measurements. Credit: NASA Jet Propulsion Laboratory")
The Global Navigation Satellite System (GNSS) refers to a constellation of satellites providing signals from space that transmit positioning and timing data to GNSS receivers. The receivers then use this data to determine location within millimeters.
GNSS can be used to determine how stations near active faults move relative to each other. Occupying several stations at the same time, and all stations observe the same satellites, the relative positions of all the stations can be determined very precisely. Months or years later Occupying the same stations again and determining how the stations have moved, the data can be used to measure how much strain is accumulating and which faults are slipping.
Research quality GNSS data can be accessed via Earthdata Search:
The U.S. GPS is a constellation of 30 satellites which is used for navigation and precise geodetic position measurements. Data from over 2000 receivers have been analyzed at NASA's Jet Propulsion Laboratory (JPL). The JPL GNSS Time Series provides time series and other useful data products.
Image
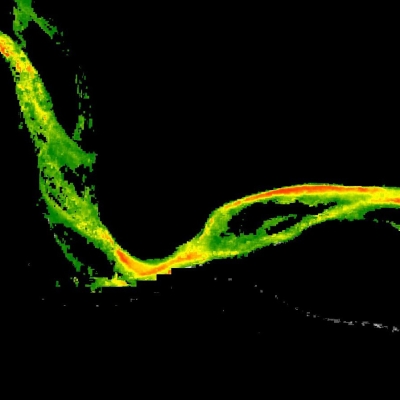
 Damage Proxy Map (DPM) depicting areas that are likely damaged caused by the 2020 Zagreb Earthquake. The map was derived from synthetic aperture radar (SAR) images from the Copernicus Sentinel-1 satellites, operated by the European Space Agency (ESA). The team compared the post-event image acquired on March 23, 2020 with pre-event images taken since January 2020.")
Geodetic imaging's unique ability to capture surface deformation caused by earthquakes and subsurface magma movement in high spatial and temporal resolution has revolutionized both earthquake science and volcanology. NASA's Advanced Rapid Imaging and Analysis (ARIA) project is using this information to bring geodetic imaging capabilities to an operational level in support of local, national, and international hazard science and response communities. The products are crafted specifically for an event.
GeoGateway makes it possible for non-expert users of geodetic imaging to overlay multiple types of data and rapidly analyze airborne radar products from Uninhabited Aerial Vehicle Synthetic Aperture Radar (UAVSAR). Custom products are also posted for some disasters, such as for the Ridgecrest earthquake sequence.
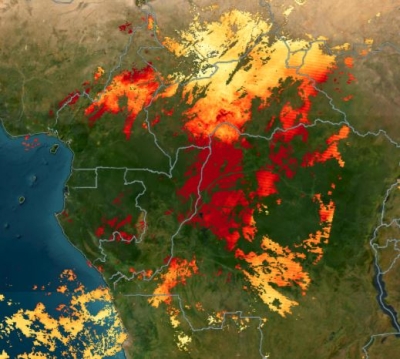
The Moderate Resolution Imaging Spectroradiometer (MODIS) instrument aboard NASA's Terra and Aqua satellites, and the Visible Infrared Imaging Radiometer Suite (VIIRS) instrument aboard the joint NASA/NOAA Suomi-National Polar-orbiting Partnership (Suomi NPP) satellite and NASA/NOAA Joint Polar Satellite System (JPSS) NOAA-20 satellites provide satellite-derived information on hotspots/fires and thermal anomalies, as well as smoke plume movement via true color reflectance imagery.
Land surface reflectance can be used to monitor and measure thick plumes of ash and steam and flows of molten lava. This is important in assessing how ash plumes might affect aviation routes and air quality and how lava flows might impact surrounding infrastructure.
- MODIS Surface Reflectance from Earthdata Search
- Suomi NPP VIIRS Surface Reflectance from Earthdata Search
Near real-time (NRT) data can be accessed via Worldview. Corrected reflectance imagery is only available as NRT data, as the processing algorithms provide natural-looking images by removing gross atmospheric effects, such as Rayleigh scattering.
- MODIS Corrected Reflectance in Worldview
- Suomi NPP VIIRS Corrected Reflectance in Worldview
- NOAA-20 VIIRS Corrected Reflectance in Worldview
Lava flows can be detected with both MODIS and VIIRS thermal anomalies datasets.
Research quality, or higher-level "standard" data products can be accessed via Earthdata Search.
- MODIS Active Fire and Thermal Anomalies from Earthdata Search
Data are available daily and in 8-day increments. - Suomi NPP VIIRS Thermal Anomalies/Fire from Earthdata Search
Data are available daily at 1 km resolution and in 6-minute temporal satellite increments (swaths) at 750 m resolution.
Note, the thermal anomalies/fire NRT data, available in Worldview, are basically a snapshot in time, showing what is occurring at the moment the data was acquired. It is determined by a contextual algorithm that utilizes the infrared or thermal radiation of the fires. Each MODIS active fire represents the center of a 1km pixel that is flagged by the algorithm as containing one or more fires within the pixel. Because VIIRS has a higher resolution, it can pick up fires that MODIS overlooks, especially those in relatively small areas. It is important to note that the NRT products are not considered standard science quality because predicted geolocation is used.
- MODIS Fires and Thermal Anomalies (Day and Night) in Worldview
- Suomi NPP VIIRS Thermal Anomalies/Fire in Worldview
- NOAA-20 VIIRS Fires and Thermal Anomalies (Day and Night in Worldview)
NASA's Disasters Volcano and Earthquake Events
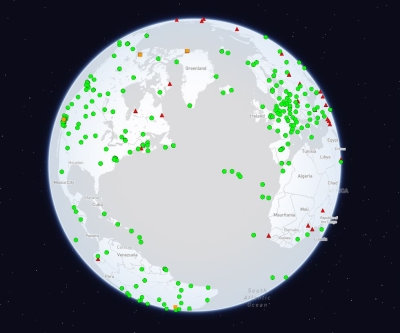
The dashboard contains experimental NASA products that may assist in preparing for or responding to a volcano. The Volcano Dashboard contains MODIS and VIIRS thermal hotspots and a non-exhaustive list of volcanoes. NASA Disasters also creates products for specific events and provides other information to help interpret the data.
Image
.")
The dispersal of aerosols such as sulfur dioxide preceding and during an event can have not only an immediate but also a long-term effect on the atmosphere. For example, in 1991 during the eruption of Mount Pinatubo in the Philippines, so much sulfur dioxide (SO2) was released that it set off a period of global cooling for several years. The aerosols released in the eruption reflected sunlight, reducing the amount of energy reaching the lower atmosphere and the Earth's surface, cooling them.
SO2 can also aggravate respiratory conditions in humans, especially those with asthma, leading to an increase in symptoms, hospital admissions, and emergency visits. In areas where there are high levels of sulfur oxides, their reactions with other atmospheric components can create small particles, which contribute to overall particulate matter (PM) levels. Particulate matter can lower visibility and, when inhaled by humans, adversely affect their health. SO2 can also lead to acid rain.
Research quality, or higher-level "standard" data products, can be accessed via Earthdata Search:
- OMI SO2 Data from Earthdata Search
Ozone Monitoring Instrument (OMI), aboard the Aura spacecraft, provides daily total column data at a resolution of 13x24 km; data are in HDF5 format, and can be opened using Panoply. - OMPS SO2 Data from Earthdata Search
SO2 Total and Tropospheric Column data from the Ozone Mapping and Profiling Suite (OMPS) Nadir-Mapper (NM) sensor on the Suomi NPP satellite; data are in HDF5 format, and can be opened using Panoply. Note that the data are at the various atmospheric levels (planetary boundary layer, stratospheric layer, and tropospheric layers). - TROPOMI SO2 data from Earthdata Search
TROPOspheric Monitoring Instrument (TROPOMI), aboard Sentinel-5P, is a European Space Agency (ESA) Mission. ESA TROPOMI SO2 provides additional information on this Level 2 data product. Data are in NetCDF format and can be opened using Panoply. Note: you may need to adjust the scaling factor in Panoply.
Data products can be visualized as a time-averaged map, an animation, seasonal maps, scatter plots, or a time series through an online interactive tool, Giovanni. Follow these steps to plot data in Giovanni: 1) Select a map plot type. 2) Select a date range. Data are in multiple temporal resolutions, so be sure to note the start and end date to ensure you access the desired dataset. 3) Check the box of the variable in the left column that you would like to include and then plot the data. For more information on choosing a type of plot, see the Giovanni User Manual.
NRT data can be accessed via Worldview:
- OMI SO2 data in Worldview
The imagery created from the data are at 2 km spatial resolution. - OMPS SO2 data in Worldview
NASA also has a global sulfur dioxide monitoring site that provides imagery of daily SO2 measurements from OMI, OMPS, and TROPOMI. The site also provides information on the source of emissions.
Image

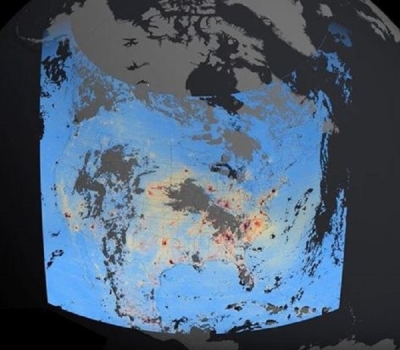
The VIIRS Day/Night Band shows the earth’s surface and atmosphere using a sensor designed to capture low-light emission sources, under varying illumination conditions, which provides an assessment of power outages across an area due to the storm event.
Note that the imagery to the right is not showing raw imagery of light. A team of scientists from NASA’s Goddard Space Flight Center and Marshall Space Flight Center, processed and corrected the raw data to filter out stray light from the Moon, fires, airglow, and any other sources that are not electric lights. Their processing techniques also remove as much other atmospheric interference as possible.
NASA has also developed the Black Marble, a daily calibrated, corrected, and validated product suite, so nightlight data can be used effectively for scientific observations. Black Marble's standard science processing removes cloud-contaminated pixels and corrects for atmospheric, terrain, vegetation, snow, lunar, and stray light effects on the VIIRS Day/Night Band radiances. Black Marble data can be accessed at NASA's Level-1 and Atmosphere Archive and Distribution System DAAC (LAADS DAAC). Black Marble imagery in Worldview is an image composite that was assembled from clear, cloud free images for 2012 and 2016. Black Marble also provides a Nighttime Blue/Yellow Composite which is a false color composite created using the VIIRS at-sensor radiance and brightness temperatures from the M15 band.
- Black Marble at LAADS DAAC
- Black Marble Imagery in Worldview
- Black Marble Blue/Yellow Composite imagery in Worldview
For more information on the VIIRS DNB and Black Marble products, read the Nighttime Lights Backgrounder.
Image

Repeat-pass radar interferometry from spaceborne platforms is routinely used to produce topographic change maps as digital displacement models (DDMs). When two observations are made from the same location in space but at different times, the interferometric phase is directly proportional to any change in the range of a surface feature. This change allows for the measurement of any displacement or ground deformation that has occurred between the time of the two observations.
Interferometric SAR (InSAR) thus provides centimeter-level measurements of displacement from earthquake ruptures and volcanic eruptions. This displacement or deformation is seen as contour lines; where the lines are closer together, there was a lot of movement. Discontinuities in the contour lines also show where the actual fault rupture is. Contour lines are half of the radar's wavelength; so Sentinel-1 with a radar length of 6 cm has contour lines indicating ground deformation of 3 cm.
Research-quality data products can be accessed via Earthdata Search or from NASA's Alaska Satellite Facility DAAC (ASF DAAC).
- Sentinel-1A and Sentinel-1B SAR data from Earthdata Search
When choosing SAR data for interferometry, inclusion of phase information is required. Level 1 data are produced as single look complex (SLC), in which the phase information is preserved. To learn more about SAR processing Level 1 data, view the ASF DAAC SAR data recipes (select InSAR). - Sentinel-1A and Sentinel-1B SAR data from Vertex
Vertex is ASF DAAC's search tool, which allows for the preview of numerous types of SAR data, including Sentinel-1. - UAVSAR from Earthdata Search
UAVSAR is an airborne SAR instrument operating at L-band. Missions over portions of North America, Greenland, Iceland, and North, Central, and South America were conducted from 2008 to present. - UAVSAR from Vertex
- ALOS PALSAR from Earthdata Search
From 2006-2011, the Phased Array type L-band SAR (PALSAR), onboard the Advanced Land Observing Satellite-1 (ALOS-1) acquired data from multiple observation modes with varying polarizations and resolutions. - ALOS PALSAR from Vertex
Radiometrically terrain corrected (RTC) data are available in GeoTIFF format.
To learn more about SAR, view What is SAR? or Getting Started with SAR; for information on processing Level 1 data, view the Introduction to SAR training from NASA's Applied Remote Sensing Training (ARSET).
SARVIEWS Hazard Portal is a SAR-based hazard monitoring service funded by NASA's Applied Sciences program and based at ASF DAAC. It is a fully automatic processing system that produces value-added products in support of monitoring natural disasters. The SARVIEWS processor is implemented in the Amazon Cloud and utilizes modern processing technology to generate geocoded and fully terrain-corrected image time series, as well as InSAR data over areas affected by natural disasters.