Dr. Steven Massie; Research Associate, Laboratory for Atmospheric and Space Physics (LASP) at the University of Colorado, Boulder, CO
Research interests: Effects of aerosols and clouds on the interpretation of NASA satellite data and the physical effects of aerosols on the troposphere.
Research highlights: As the song says, on a clear day, you can see forever. That is, of course, unless microscopic suspended particles in the atmosphere, called aerosols, restrict visibility. While atmospheric aerosols occur naturally from a wide range of sources, including ash from volcanic eruptions and smoke from wildland fires, human activity has significantly increased their concentrations. This is easily seen in photographs of cities like Beijing, China, and New Delhi, India, where a gray to yellow cloud turns an otherwise clear day into a twilight of fog.

Haze and reduced visibility caused by atmospheric aerosols are not only visible on the ground. High aerosol concentrations also can be observed and tracked from space using instruments aboard Earth observing satellites. NASA has collected data on atmospheric aerosols for more than 40 years, about the same amount of time Dr. Steven Massie has used these data to analyze and study the impacts of aerosols on the lower atmosphere and explore ways these particles can be better detected by satellite-borne instruments.
The atmospheric data used by Massie are part of NASA’s Earth Observing System Data and Information System (EOSDIS) collection, and are available through several EOSDIS Distributed Active Archive Centers (DAACs). The primary DAAC through which Massie acquires the data he uses in his current research is NASA’s Goddard Earth Sciences Data and Information Services Center (GES DISC), which archives and distributes EOSDIS data related to atmospheric composition and atmospheric dynamics, global precipitation, and solar irradiance. Other EOSDIS DAACs with collections of aerosol data include NASA’s Atmospheric Science Data Center (ASDC) and NASA’s Level 1 and Atmosphere Archive and Distribution System (LAADS DAAC).
Aerosols directly impact the lowest level of Earth’s atmosphere, called the troposphere, which extends from Earth’s surface to an average altitude of 10 km (about 33,000 feet). As Massie notes, aerosols in the troposphere can have both a warming and a cooling effect. Aerosols comprising desert dust and carbon-based soot (such as from agricultural burning) absorb and trap radiation in the atmosphere, which prevents heat from escaping into space and contributes to atmospheric warming. Conversely, suspended aerosols also can scatter a fraction of incoming solar radiation back to space, which leads to atmospheric cooling. In addition, aerosols also serve as condensation nuclei for raindrop formation and can lead to a higher amount of smaller cloud droplets. This higher number of cloud droplets can result in more extensive areas of clouds that can reflect radiation back into space and further contribute to atmospheric cooling.
Atmospheric aerosols also impact human health. Aerosols with a diameter less than 2.5 micrometers (µm)—which is about 30 times smaller than a human hair—are easily inhaled and can penetrate deep into the lungs (and even into the bloodstream). According to the U.S. Environmental Protection Agency (EPA), concentrations of 2.5 µm particulate matter (notated PM2.5) above 35 micrograms per cubic meter (µg/m3) over a 24-hour period are considered unhealthy. While a clear, non-hazy day can have PM2.5 concentrations as low as 5 μg/m3, cities such as New Delhi, India, and Cairo, Egypt, have average annual PM2.5 concentrations of more than 140 µg/m3 and 110 µg/m3, respectively, based on World Health Organization (WHO) Global Ambient Air Pollution data.

One key measurement of aerosols collected by Earth observing satellites is aerosol optical depth (AOD). AOD is a measure of the amount of light absorbed and scattered by atmospheric aerosols. An optical depth of less than 0.1 indicates a clear sky with maximum visibility; values of 1.0 or higher indicate the presence of aerosols so dense that people would have difficulty seeing the Sun and could experience health impacts. AOD can be explored globally using the NASA Worldview data visualization application.
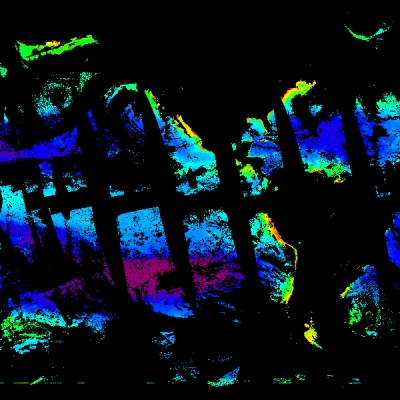
NASA has collected aerosol and AOD data using a number of satellite-borne instruments. In a study looking at aerosol concentrations over Asia between 1979 and 2000, Massie and his colleagues used 20 years of AOD data acquired by NASA’s Total Ozone Mapping Spectrometer (TOMS) instrument. TOMS flew aboard several NASA and international satellite missions starting with NASA’s Nimbus-7 mission in 1978. The research team specifically looked at TOMS AOD data collected between November and February—months during the Northern Hemisphere winter in which the influences of desert dust and smoke from fires in Asia are generally less than in other months. As noted by Massie and his colleagues, the populations of China and India increased 26 percent and 23 percent per decade, respectively, between 1979 and 2000, with accompanying increases in coal, oil, biomass consumption, and land‐altering activities. During this time, TOMS AOD data show that aerosol concentrations increased by 17 percent per decade and sulfur dioxide (SO2) emissions increased by 35 percent per decade during winter over the China coastal plain.
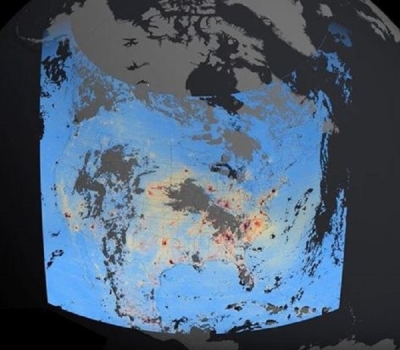
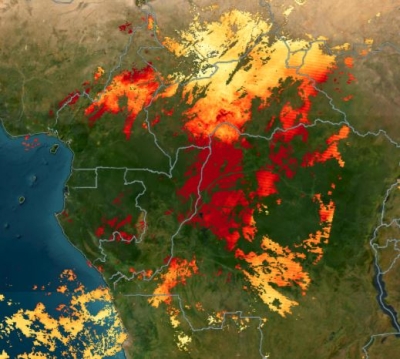
Massie’s current research uses data from NASA’s Orbiting Carbon Observatory-2 (OCO-2) mission (operational 2014 to present). OCO-2’s primary science objective is to collect measurements of atmospheric carbon dioxide (CO2) and quantify the variability of CO2 over seasonal cycles. OCO-2 provides roughly 100,000 global CO2 measurements every day, and OCO-2 data are available through NASA’s GES DISC. OCO-2 data soon will be complemented with data from OCO-3, which was installed on the International Space Station on May 6, 2019, and began science operations on June 25, 2019. While OCO-2 circles Earth in a 705-km polar orbit, the space station orbits Earth between 52 degrees north and south latitude at an altitude ranging from 330 to 435 km. This lower orbit enables OCO-3 to collect denser data than OCO-2 over high-carbon regions, such as the Amazon and most major global cities. OCO-3 data are expected to be publicly available in 2020.

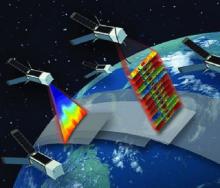
OCO-2 measures CO2 indirectly by measuring the intensity of sunlight reflected by molecules of CO2 in a column of air. Atmospheric CO2 absorbs light energy at specific wavelengths, and the OCO-2 instrument uses a diffraction grating (like the back of a compact disk) to separate incoming sunlight into a spectrum of multiple component colors. OCO-2 CO2 measurements are based on the number of molecules of CO2 per cubic meter. When CO2 is measured, the quantity that is being determined is the “mole fraction” of CO2 in a column of air (see illustration at right). This is the number of CO2 molecules in a column of air after removal of water vapor, and is designated XCO2.
While this measurement strategy works fine in clear air, OCO-2 measurements can be biased by clouds within and outside the instrument’s field of view. The shapes, altitudes, and even colors of clouds constantly change. This, in turn, continually changes the amount of cloud-reflected light that is received by the OCO-2 instrument. As a result, methods for screening out cloud-influenced measurements are a focus of OCO-2 algorithm developers.
In a recent research project, Massie was part of a team that used OCO-2 data along with data from NASA’s Moderate Resolution Imaging Spectroradiometer (MODIS) instrument to examine biases caused by clouds in the retrieval of OCO-2 data. Observing that the OCO-2 objective is to measure CO2 to better than 1 percent accuracy on regional scales (defined on the OCO-2 website as 1,000 kilometers or greater), Massie and his colleagues analyzed OCO‐2 CO2 measurements and MODIS satellite radiance and cloud fields. The team found that as cloud fields become less uniform and more spatially heterogeneous, cloud-reflected light causes greater variations of OCO‐2 CO2 measurements at local scales, which the research team defines as 20 km×20 km. Based on the results of this research, Massie and his colleagues recommend that OCO-2 data algorithm development should incorporate techniques designed to deal with instances when cloud fields are not uniform and light is not reflected evenly to help deal with these potential biases in CO2 retrievals.
Thanks to research by Massie and his colleagues, our ability to retrieve and utilize accurate data about aerosols and clouds, along with our ability to better understand their impacts on Earth’s troposphere, continues to improve. This, in turn, is leading to better data to help develop more informed policies to deal with the effects of aerosols.
Representative data products used:
- OCO-2 data products available through NASA’s GES DISC:
- Calibrated Spectra:
- OCO-2 Level 1B calibrated, geolocated science spectra, Retrospective Processing V8r (doi:10.5067/1RJW1YMLW2F0)
- Retrievals of CO2:
- OCO-2 Level 2 bias-corrected XCO2 and other select fields from the full-physics retrieval aggregated as daily files, Retrospective processing V9r (doi:10.5067/W8QGIYNKS3JC)
- Calibrated Spectra:
- MODIS data products available through NASA’s GES DISC:
- Geostationary Radiances from the Advanced Baseline Imager (ABI) aboard the joint NASA/NOAA Geostationary Operational Environmental Satellite-R Series (GOES-R) GOES-16 satellite; available through NOAA’s Comprehensive Large Array-Data Stewardship System (CLASS)
Read about the research:
Massie, S.T., Sebastian Schmidt, K., Eldering, A. & Crisp, D. (2017). Observational evidence of 3D cloud effects in OCO-2 CO2 retrievals. Journal of Geophysical Research: Atmospheres, 122(13): 7064-7085. doi:10.1002/2016JD026111
Massie, S.T., Gille, J, Craig, C., Khosravi, R., Barnett, J., Read, W. & Winker, D. (2010). HIRDLS and CALIPSO observation of tropical cirrus. Journal of Geophysical Research, 115. doi:10.1029/2009JD012100
Massie, S.T., Torres, O. & Smith, S.J. (2004). Total Ozone Mapping Spectrometer (TOMS) observations of increases in Asian aerosol in winter from 1979 to 2000. Journal of Geophysical Research, 109(D18). doi:10.1029/2004JD004620