EOSDIS Science Data Metrics
Note:
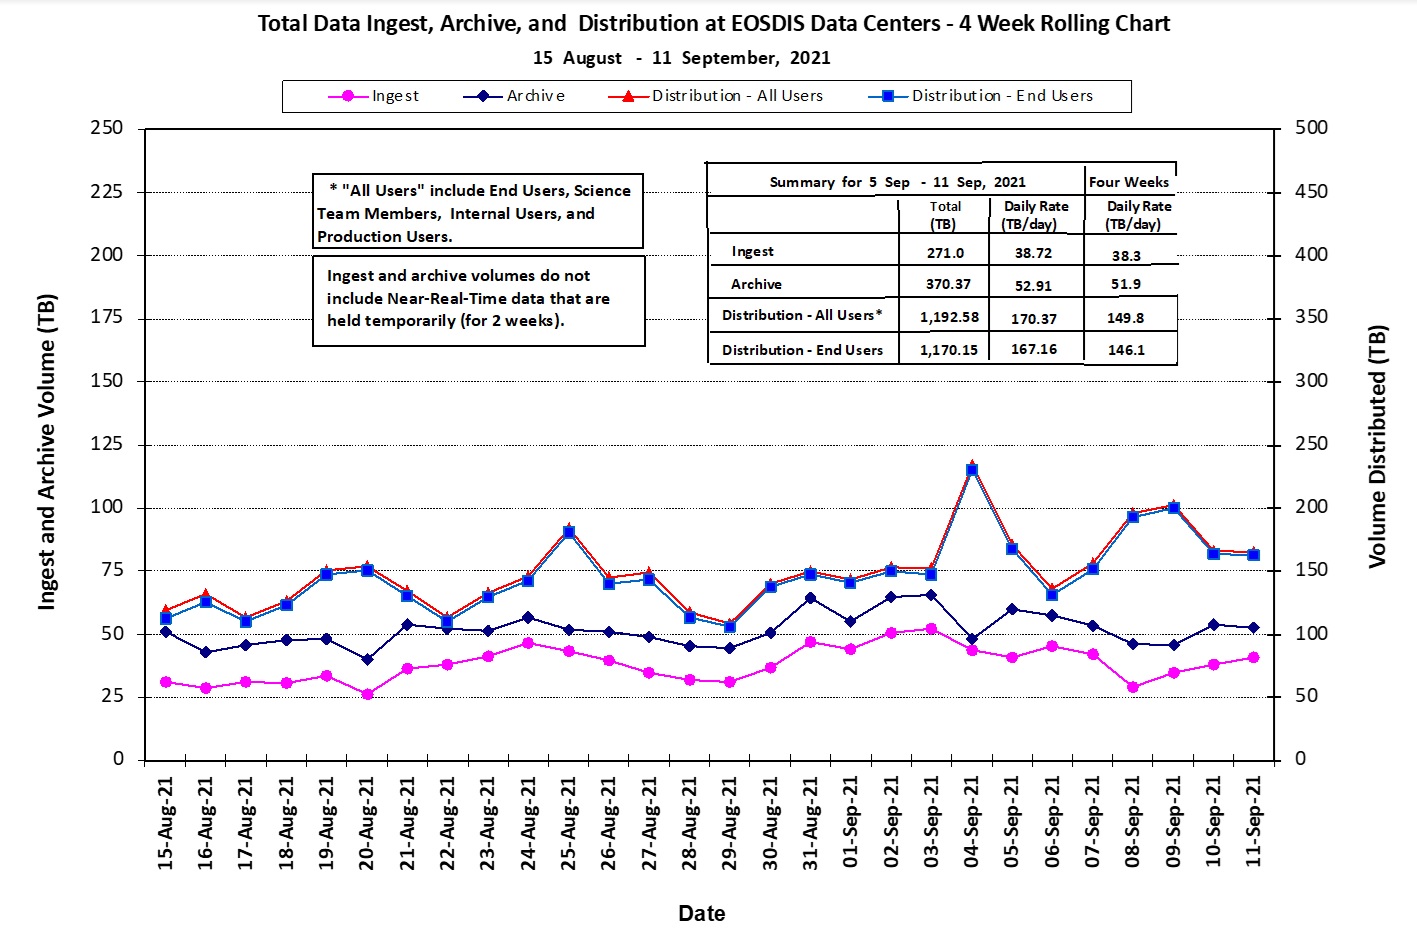
1. The volume distributed to end users per day, as a running average over the last 4 weeks, is 2.8 times the volume added to the archive per day.
LANCE Data Latency
Note: None
Note:
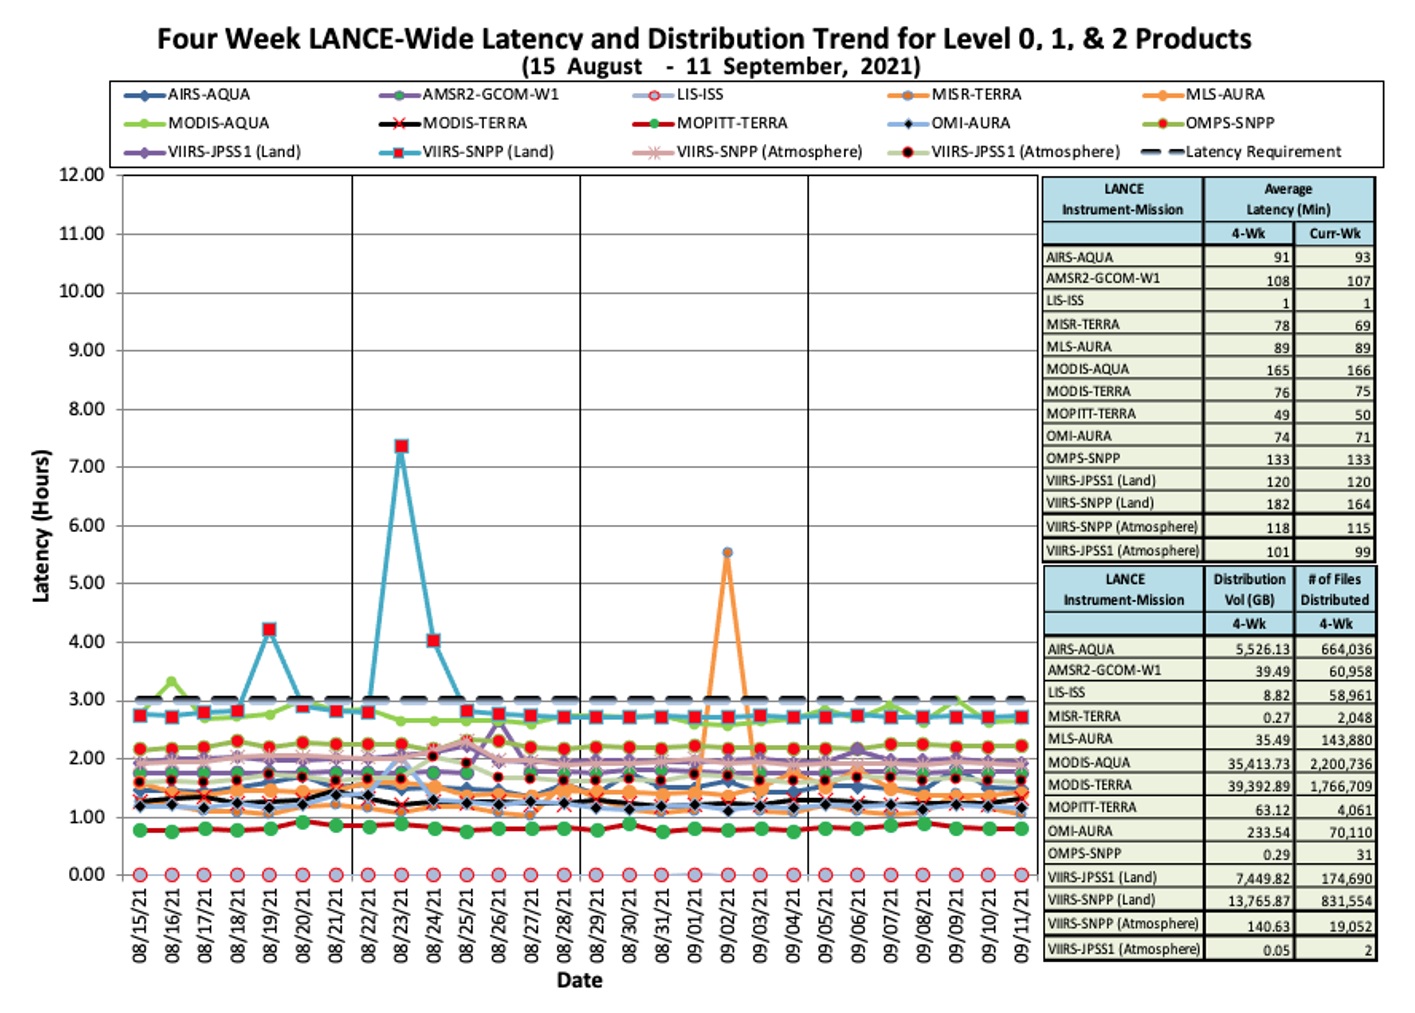
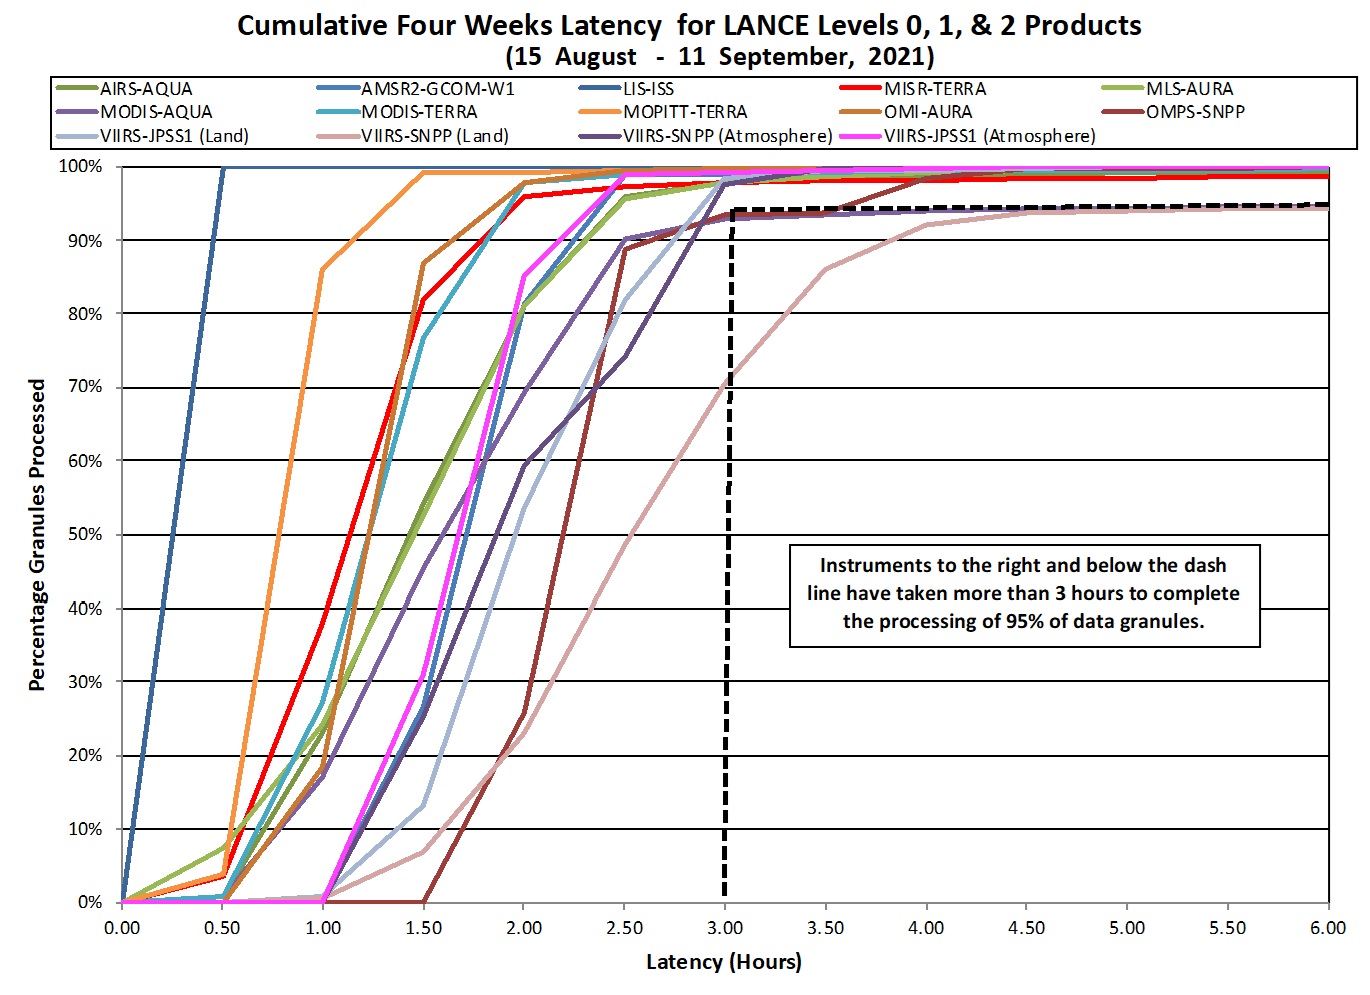
- Latency for a data granule is defined as the time taken from the midpoint between the start and end of acquisition of the data for that granule to the granule’s being ready on-line for users to download.
- Duration covered by the data for a granule is defined differently for different instruments (e.g., MODIS granules are 5 minutes long while OMI NRT granules are 13 to 136 minutes long).
- Over the last four weeks, over 95% of NRT data requests for all instruments except for three instruments (MODIS-AQUA, OMPS-Suomi NPP and VIIRS-Suomi NPP (Land)) were satisfied within 3 hours. For MODIS-AQUA, OMPS-Suomi NPP and VIIRS-Sruomi NPP (Land) over 93%, 93% and 70% of the NRT data requests were satisfied within 3 hours, respectively.
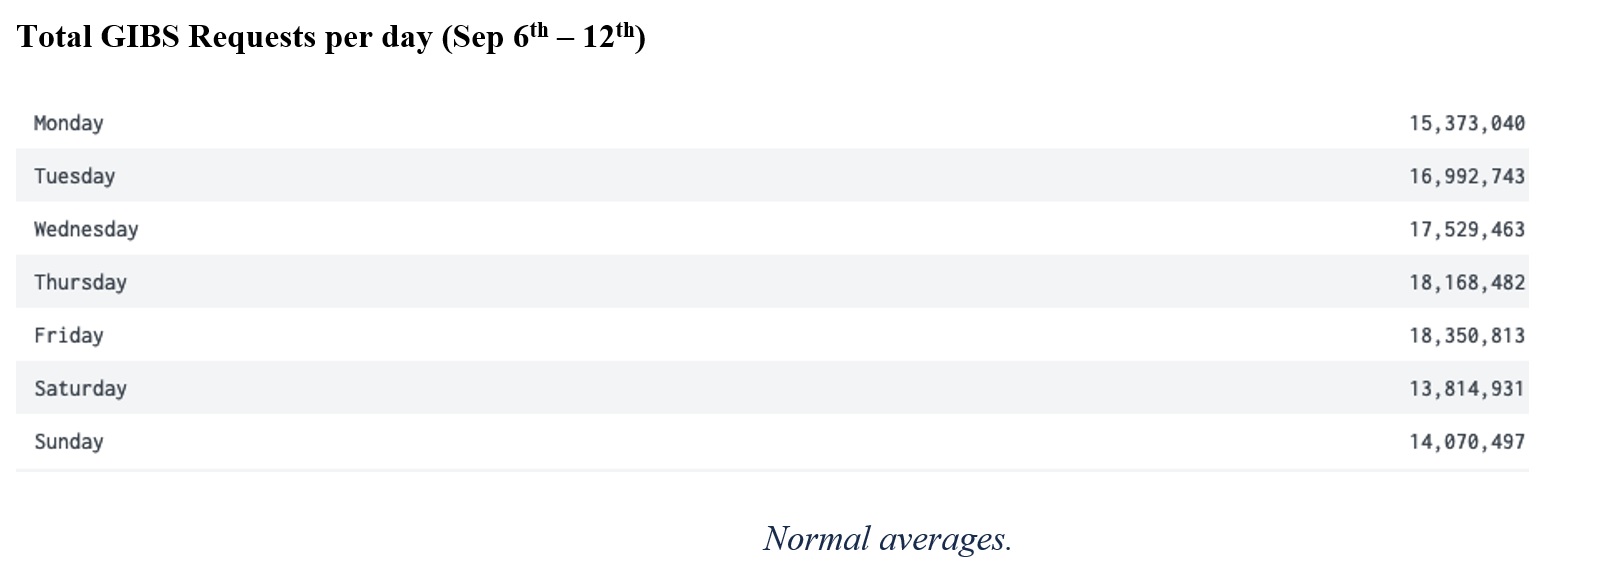
Global Imagery Browse Services (GIBS)
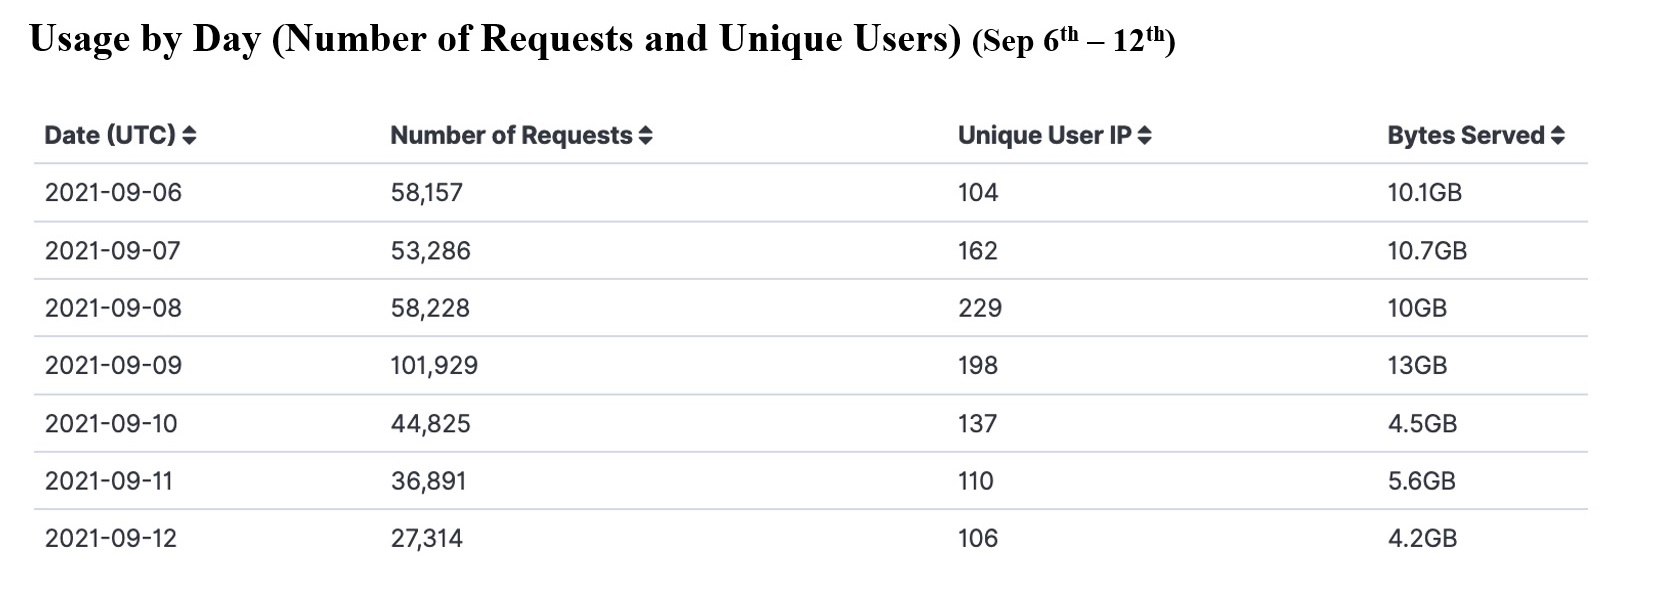
GIBS in the Cloud (GITC)
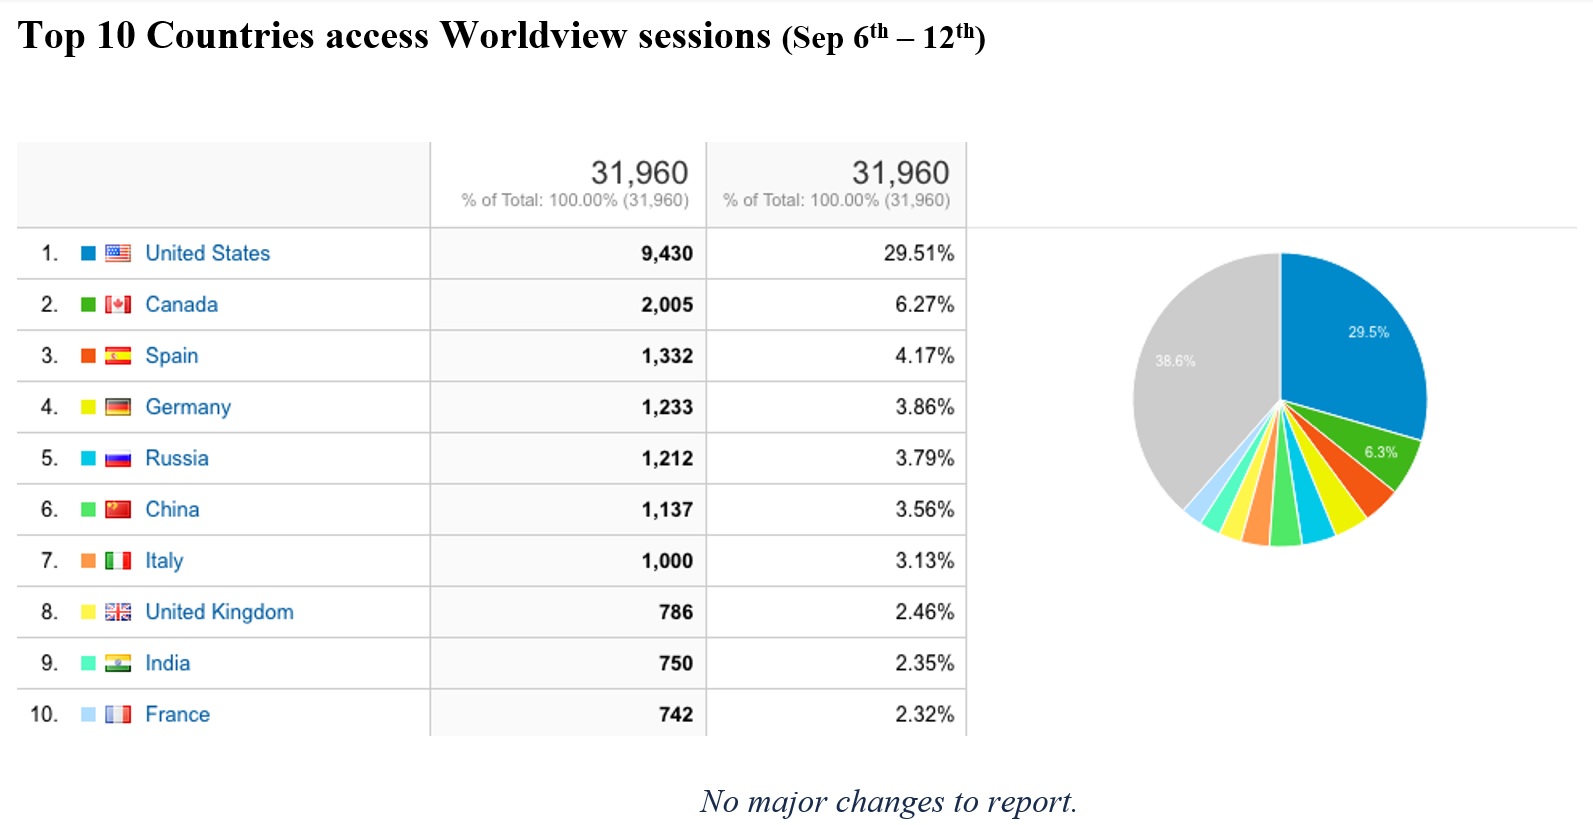
Worldview
Metrics from previous weeks are organized by week, and users can access the ESDIS Weekly Metrics Archive.
