In 2018 and 2021, ships and researchers funded by NASA and the National Science Foundation (NSF) set out across the Pacific Ocean and the Atlantic Ocean in a massive field campaign. The crews were part of the NASA-led Export Processes in the Ocean from Remote Sensing (EXPORTS) project to track how organic carbon is biologically produced, processed, and stored in the depths of the ocean.
Carbon is a major component of the greenhouse gases driving global climate change. According to NASA's Carbon Cycle webpage, the global ocean holds approximately 50 times more carbon than the atmosphere and sequesters as much as 48% of the carbon produced by burning fossil fuels (the global ocean is estimated to sequester 25-35% of carbon released into the atmosphere from all sources). Understanding the carbon cycle and budget is important for predicting the future health of the ocean and its ability to produce oxygen and absorb carbon in the face of climate change.
NASA has decades of atmospheric carbon data from satellites and other sources, but to complete the overall picture, scientists need to study how carbon is produced and moves through the ocean, which is exactly what EXPORTS aims to do. NASA ultimately will use EXPORTS data to develop models for predicting the health and fate of carbon in the ocean. The campaign rivals a space mission in its length, complexity, and coordination. And while state-of-the-art vessels, instruments, and adventurous scientists have been critical to EXPORTS’ success, ensuring that the data acquired are complete, high-quality, and easily accessed has been equally important.
Carbon in the Ocean

The ocean's carbon comes from the atmosphere and the plants, animals, organisms, and other natural materials in its waters. Microscopic organisms called phytoplankton are a key source of ocean carbon. Phytoplankton, in turn, are food for many oceanic animals called zooplankton. Scientists already know that carbon from phytoplankton, zooplankton, and other organisms (along with their waste products) is transported down through the vertical zones of the ocean. Some carbon eventually settles in the deepest depths where it can remain for hundreds or even thousands of years. What scientist would like to better understand is how exactly this process happens and how much of the carbon produced in surface waters is exported to deeper waters and eventually sequestered in order to predict how much carbon the ocean can hold and the role of the ocean in climate change.
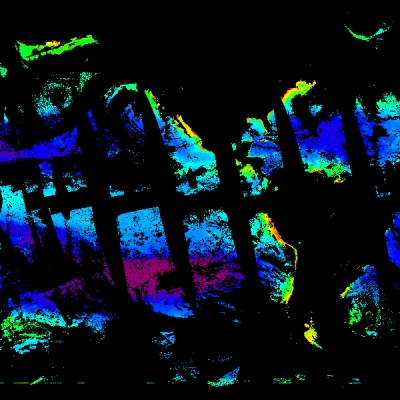
EXPORTS scientists studied the ocean’s carbon processing cycle during two month-long expeditions, one to the North Pacific in 2018 and another to the North Atlantic in 2021. The expeditions involved up to 53 assets including ships, buoys, gliders, and other devices that gathered millions of pieces of data. These data were gathered from the open ocean as well as an ocean feature with a very handy attribute: whirling, swirling eddies.
Eddies are relatively small (up to 300 km/200 mi. wide) and temporary spinning columns of water within the larger ocean. The spin of eddies creates a boundary that isolates them from the rest of the ocean and traps microscopic animals, plants, and other scientifically interesting material. The isolating aspect of eddies makes them ideal areas in which to study the function and physics of the ocean's carbon cycle.
“To gather data, you can position a ship in the ocean and let it flow by you or you can pretend you are part of the ocean and follow a parcel of water to track the biological processes taking place within it,” said project scientist Dr. Ivona Cetinić. “By staying in the eddy, we account for the physical forces and know any changes detected are from biological processes and not because the water we were measuring has flowed away and now things have changed.”
Determining the Data

The thousands of experiments and measurements conducted during the two EXPORTS campaigns were designed to fulfill NASA and NSF mission goals as well as support individually funded research studies from scientists and institutions. This means there was a complex mix of data to be gathered and handled by many people in many different ways.
“We did quite a lot of pre-data work, which is unusual for field campaigns where it’s often relatively easy to redo measurements or make changes,” said Cetinić. “This was more like a space mission, because once you're out there, there isn’t a lot of flexibility to improvise; you want to seize the opportunity to gather as much data in specific ways as you can.”
Part of EXPORTS’ pre-data work involved Cetinić and her team advising principal investigators (PIs) on the data they were going to need and how to best get the data to answer their research questions. Cetinić and the EXPORTS Project Office also required all PIs to complete data management plans.
“It's something common in satellite science, but not in complex in situ campaigns such as this one,” said Cetinić. “It was really helpful because the information could then be compiled into one master document, and we could see all the data streams that would be coming in.”
Having a clear understanding of all the data to be gathered allowed the EXPORTS Project Office to coordinate sampling among the different PIs and campaigns to figure out ways to make the measurements complete, efficient, and complementary. The data coordination also helped the team identify instances when redundant measurements would be taken, which would then require inter- and cross-calibration so that measurements made on different platforms could be used together. In the larger scheme, understanding the big data picture showed the EXPORTS team when and where it would make sense to blend individual sampling efforts so that they could use the data to answer both smaller PI-driven and bigger mission-driven research questions.
Out to Sea

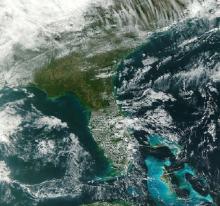
EXPORTS headed to the North Pacific first because conditions were expected to be stable and calm and simpler from a carbon processing standpoint. Data handling was easier as well, and taken care of by Cetinić and a few people on the ships with only small-scale data transfers back to the project’s home at NASA’s Goddard Space Flight Center in Greenbelt, Maryland.
“Sampling in the North Pacific was like running through a meadow,” said Cetinić.
The North Atlantic, however, was another story. The second campaign was considered much more complex due to the COVID-19 pandemic, a higher number of scientific platforms, the more complicated biology and physics of the North Atlantic, technical issues, and, of course, weather.
“The North Atlantic was megastorm after megastorm always changing the conditions,” said Cetinić.
During this second campaign, Cetinić relied on oceanographer and NASA Data Manager Dr. Inia Soto Ramos at Goddard to quickly organize, analyze, and assess the data coming from the North Atlantic.
“Every day we would use data from buoys, ships, and other sources to locate the center of the eddy we followed across the North Atlantic,” said Ramos. “These data were sent back to the chief scientists to guide them in repositioning assets and defining the sampling scheme for the next days.”
The Data Download
With the large variety of projects taking place during EXPORTS, researchers had an array of ways they were transmitting and storing their data. Much of the data were transmitted from ships through the Iridium Satellite Communications Network, where they were then distributed through FTP servers, websites, email, and other methods.
Cetinić and Ramos developed multiple strategies for wrangling the data. These ranged from using application program interfaces (APIs) to pull the information from servers to manually downloading data from websites. Once the data were in hand and checked for quality, Ramos forwarded them to EXPORTS collaborators at the University of Washington to plot the positions of assets and their current data on an interactive Google Earth map for quick reference and planning during the campaigns.
Archiving for Others
After the Pacific and Atlantic cruises were complete, NASA began acquiring and archiving the approximately 13,000 datasets gathered by the researchers. These agency efforts provide vital data to help power carbon cycle models under development and ensure the data can be accessed by researchers for other studies in accordance with the agency’s open science policies.
“There is now an incredible diversity and abundance of data,” said Cetinić. “For example, one instrument sampled water every 12 minutes for a month and could identify thousands of particles in just a tiny sample of water. This means there are now thousands of images that have to be properly archived—and that’s just for this one instrument!”
EXPORTS data are available through NASA’s Ocean Biology Distributed Active Archive Center (OB.DAAC), which is NASA’s repository for ocean biology and ocean color data. The data can be accessed through OB.DAAC’s SeaWiFS Bio-optical Archive and Storage System (SeaBASS).
SeaBASS was created to house in situ data for validating satellites making ocean surface measurements from space, but was not set up to handle the immense variety of types of data collected during EXPORTS. Ramos and the SeaBASS staff added approximately 400 new fields and parameters to the system to accommodate the new types of data from EXPORTS.
“Most of the data served to the public have a first level of processing, such as calibration and basic corrections, and all-optical data are assigned to an internal reviewer for quality analysis and control,” said Ramos.
EXPORTS project managers estimate that some of the researcher datasets are so big they could take years to submit. Ramos and the EXPORTS team are trying to make the process easier by working with researchers to make sure data are formulated correctly, checked for quality, and reviewed by a data management group.
“As a group, oceanographers are used to doing research and publishing papers; submitting data to repositories is not so ingrained in them,” said Ramos. “It’s a relatively new practice to make sure the data are available for others to use, so we help them do it.”
Through thoughtfulness, intelligent planning, and shear diligence, Cetinić, Ramos, and the rest of the EXPORTS team have developed an open, comprehensive, and accommodating approach for managing data across all stages of the mission. Their hard work has not only ensured that NASA has the data it needs to develop carbon cycle models, but also charted a data management path for scientific voyages to come.