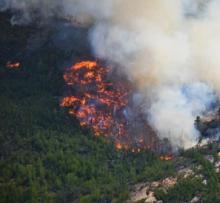
Hurricane Katrina made landfall in New Orleans, Louisiana, at 6:10 a.m., Central Time, on August 29, 2005. Most of the city’s residents had already evacuated by that time, but according to Smithsonian Magazine, “about 150,000 people, largely low-income or disabled residents, remained.” It has been estimated that 986 of those who stayed lost their lives, more than 50% of the total fatalities from the storm. Those who survived, the magazine goes on to say, “lived in squalid conditions in the weeks and months following the storm,” with tens of thousands of people stranded without access to electricity or potable water.”
As these quotes reveal, the impacts of disasters, be they natural or human-caused, aren’t shared equally. Often, it‘s the people living in the poorest and most vulnerable communities who bear a disproportionate amount of the burden and take the longest to recover.
The degree to which a community can minimize human suffering or cope with the impact of a disaster is often associated with certain social conditions, including poverty and other socioeconomic factors, housing characteristics, and disability status. And when considered in sum, these factors characterize a community’s social vulnerability. To help public health officials and emergency response planners assess social vulnerability across the United States, the Geospatial Research, Analysis, & Services Program (GRASP) of the Centers for Disease Control and Prevention’s (CDC) Agency for Toxic Substances and Disease Registry created the CDC Social Vulnerability Index (SVI), which locates and ranks communities that will most likely need support before, during, and after a hazardous event.
The SVI ranks the vulnerability of every U.S. census tract (i.e., subdivisions of counties for which the U.S. Bureau of the Census collects statistical data) on 15 social factors, including unemployment, minority status, and disability, associated with one of four themes: Socioeconomic, Household Composition and Disability, Minority Status and Language, and Housing Type and Transportation. Each tract is then given a ranking for each theme and overall vulnerability.
Now, NASA’s Socioeconomic Data and Applications Center (SEDAC) has released a U.S. Social Vulnerability Index Grids dataset offering gridded layers for the CDC SVI data. The dataset is based on inputs at the census-tract level for each of the CDC’s 15 social vulnerability variables for the years 2000, 2010, 2014, 2016, and 2018, and aligns with SEDAC′s Gridded Population of the World (GPW) dataset, which is based on detailed U.S. Census geography.
“The primary use of the dataset is the ability to return SVI values for user-defined areas instead of being constrained by the tract-level geographies of the original data set,” said Dr. Alex de Sherbinin, Deputy Manager at SEDAC.
SEDAC, which is hosted at Columbia University’s Center for International Earth Science Information Network (CIESIN), is the NASA Earth Observing System Data and Information System (EOSDIS) Distributed Active Archive Center (DAAC) responsible for archiving and distributing socioeconomic data in the EOSDIS collection. SEDAC synthesizes Earth science and socioeconomic data and serves as an “information gateway” for a wide range of decision makers and other applied users.
According to Dr. Carolynne Hultquist, developer of SEDAC’s U.S. Social Vulnerability Index Grids dataset and postdoctoral research scientist at CIESIN, the U.S. Social Vulnerability Index Grids dataset was created to enhance the CDC’s SVI census tract dataset.

“We produced the dataset using programming at CIESIN to grid the census tracts and mask out areas that are not populated,” she said. “Removing areas over water and without population allows users to better represent vulnerability for exposure applications. A hazard may affect only part of a census tract, so it is useful to understand both the level of vulnerability and whether or not the area is populated.”
Hultquist was inspired to remove unpopulated areas after reading a paper that estimated exposure to sea-level rise based on census tract data, but lacked data on where those populations actually were.
“This provides an additional way to make better estimates in a spatial format that's refined for doing exposure and hazard assessments and assessing environmental justice concerns,” she said.
SEDAC’s gridded SVI dataset uses the same four themes as the CDC SVI dataset to rank communities on vulnerability for the entire United States (including Alaska and Hawaii). SVI values range between 0 and 1 based on their percentile position among all census tracts in the U.S., with a score of 0 representing lowest vulnerability and a score of 1 representing highest. These numerical rankings can provide specific socially and spatially relevant information that emergency responders, public health officials, and municipal planners can use to better prepare communities to respond to a range of emergencies, including severe weather, floods, disease outbreaks, and chemical exposure.
According to the CDC, SVI rankings can also be used to:
- Create evacuation plans that provide adequate resources for those who have special needs, such as those without vehicles, the elderly, or people who do not speak English well
- Estimate the amount and variety of supplies such as food, water, medicine, and bedding to help communities cope with an emergency
- Allocate emergency preparedness funding
- Determine the level of emergency personnel required to assist people during and after an emergency
- Identify areas in need of emergency shelters and determine their optimal location
- Detect communities that will need continued support to recover following an emergency or natural disaster.
SEDAC’s new dataset enhances these applications by offering greater flexibility and compatibility with other spatial data and by facilitating spatial analysis focused on differential exposure, vulnerability, and/or resilience that underlie environmental justice concerns.
“This gridded product enables users to obtain vulnerability metrics along with population estimates for any user-defined area within the United States, or can be integrated with other spatial data to identify social vulnerability levels in areas such as disaster risk zones, coastal areas, or urban-versus-rural areas,” writes Hultquist and her colleagues in the SEDAC dataset documentation. “This can be a significant advantage for understanding patterns of vulnerability in relation to hazard exposure.”
As a case in point, Hultquist and her SEDAC colleagues are evaluating the use of this dataset to assess the vulnerability of communities to several hazards associated with the changing climate. The data are also potentially useful in air quality, flooding, and urban heat exposure studies that seek to differentiate impacts based on both environmental and socioeconomic factors. The gridded format of the new product makes it straightforward to perform analysis with raster products from remote sensing and modeling sources. Therefore, Hultquist hopes the dataset will be beneficial to the hazard response, urban planning, remote sensing, and environmental justice communities.

“I see a real value in bringing together physical and social data for assessing hazard vulnerability,” she said. “Typically, spatial data comes in various formats that may not be easily integrated. We hope to promote environmental justice efforts through social products that are available in a raster format and that can be combined more easily with hazard products.”
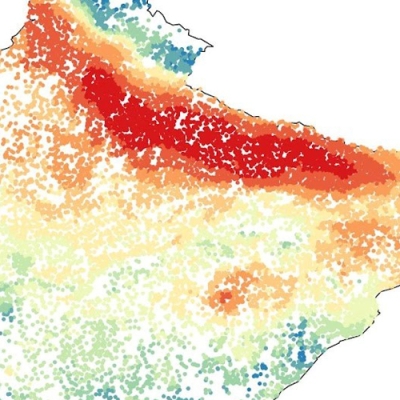
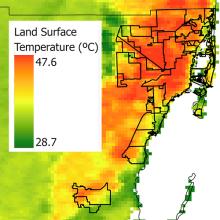
Communities can improve their capabilities to identify vulnerable populations with tailored high-resolution products. For example, in 2021, SEDAC, in partnership with the International Research Institute for Climate and Society (IRI) at Columbia University, developed a flood vulnerability index for Harris County, Texas, which is home to the fourth most populous U.S. city—Houston. Urban sprawl in Harris County has made Houston increasingly prone to flooding that is exacerbated by increased precipitation, low topography, and land-use change.
Following a rigorous analysis of the factors associated with flood vulnerability, SEDAC mapped and analyzed a set of 15 individual vulnerability indicators and combined them into an aggregate index. The vulnerability map offers a visualization of flood vulnerability at the block-group level for Harris County and other areas in the region. It also revealed pockets of increased flood vulnerability that were not evident in lower-resolution social vulnerability maps, such as the SVI maps produced by the CDC at the census tract-level.
SEDAC’s SVI gridded dataset takes social vulnerability assessments like this one a step further by allowing users to obtain both vulnerability metrics and estimates of affected populations for any area of interest within the United States. Urban planners, emergency managers, policymakers, and environmental justice advocates can then use these data to not only identify other vulnerable communities like those in Harris County, but to guide disaster preparation and response, and allocate resources to address the disproportionate burdens underserved communities typically face in the wake of disasters, be they natural or human caused.
How to Access the Data
Users can access the U.S. Social Vulnerability Index Grids dataset (version 1) for the years 2000, 2010, 2014, 2016, and 2018 via the SEDAC website. The site also offers several maps—one for each of the four themes and one showing overall SVI scores—allowing users to visualize the index and its components for the U.S. as a whole. (Note: users can find an interactive map of the 2018 U.S. Social Vulnerability Index Grids on the Columbia Climate School website.)
The gridded data are available for download in GeoTIFF format. Each file is a compressed zip file, which contains the Social Vulnerability Index Grids for the United States for the specified year and projection, and a PDF file containing the dataset documentation. The data can be used in any standard geographic information system (GIS) for direct mapping and geospatial analysis.
For additional information on the dataset, including the limitations of the data, users should consult the dataset documentation.