Every summer, up to 600 people die in Miami-Dade County, FL, from extreme heat exposure. This means that roughly 8% of deaths each summer in the area are from illnesses caused or made worse by weather with a heat index of 86°F or higher (the heat index is how hot it feels to the human body when relative humidity is combined with the actual air temperature). To save lives, Miami-Dade County commissioned a NASA-funded study in 2021 that uses the depth and one-of-a-kind perspective of NASA Earth science data along with census and local health department data to determine which communities and people are most or disproportionately at risk for extreme heat illness.
The study was led by Dr. Christopher Uejio, a professor in Florida State University’s College of Social Sciences and Public Policy and a researcher for NASA’s Health and Air Quality Applied Sciences Team (HAQAST). HAQAST’s goal is to connect health and air quality experts and community-serving organizations with NASA Earth science data and tools to solve their real-world problems.
Miami-Dade County initiated the study after a 2020 community survey of more than 100 local citizens and organizations found that, after housing and security, extreme heat was the third greatest topic of concern about living in the area. The Human Rights Watch organization coordinated with the county and Uejio to conduct the survey, on which he served as a technical advisor. The survey work eventually led to an opportunity for Uejio and the HAQAST Environmental Justice Tiger Team to perform the county-wide heat exposure study. HAQAST studies such as this one are funded by NASA’s Earth Science Division with data and supporting analysis tools provided by the agency’s Earth Science Data Systems (ESDS) Program.
“The survey showed a lot of people were already suffering from extreme heat, and community and governmental organizations did not necessarily have the means to see how big of a problem it is and how adapt to it,” said Uejio. “For the [heat exposure] study, we needed to help Miami-Dade County answer the basic questions of how many people are suffering from extreme heat, where are people disproportionately suffering, and when is it happening.”
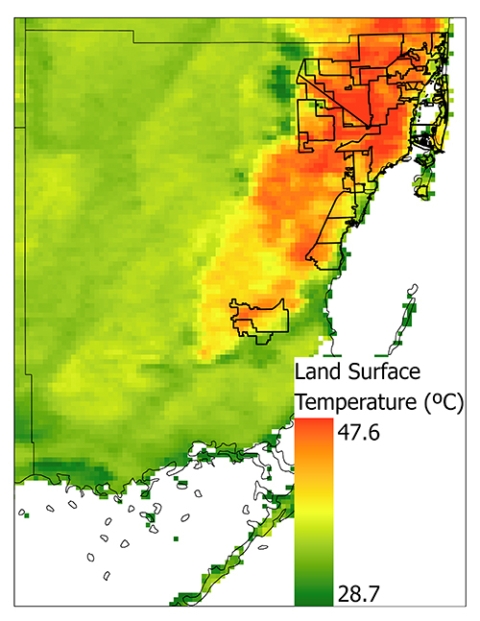
A key portion of the study involved creating long-term, summer season (May to September) average land surface temperature maps of the area from 2003 to 2021. The maps would help with the larger health equity analysis looking at where heat-related illness was taking place and characterizing those neighborhoods and the people who live there. To make those maps, Uejio and the study team used the more than 20-year archive of data from the Moderate Resolution Imaging Spectroradiometer (MODIS) aboard NASA’s Aqua satellite. Among its many abilities, the MODIS sensor aboard Aqua can measure land surface temperatures during the day or night nearly anywhere on Earth at least once per day.
“This study simply wouldn’t have been possible without the MODIS data because Miami-Dade doesn’t have the on-ground network to record temperatures throughout the county,” said Uejio.
Uejio is a long-time user of NASA Earth science data, and quickly saw how these data could help Miami-Dade County answer its questions.
“I’ve been using NASA data since 2006 to study the urban heat island effect and heat exposure,” said Uejio. “I’m a geographer, so, it was kind of intuitive to use satellite data. Half of the researchers making heat vulnerability maps right now aren’t accounting for exposure. The other half, including me, do account for exposure—and partner with Earth scientists to perform the data gathering, analysis, and interpretation.”
For this study, Uejio partnered with Dr. Leiqiu Hu, a fellow HAQAST researcher and an associate professor in the Department of Atmospheric and Earth Science at the University of Alabama in Huntsville, to manage the acquisition and analysis of the MODIS data.
“We gathered the MODIS data using the Earthdata Search portal,” said study co-author Hu. “We focused on long-term temporal composite data derived from mostly clear, cloudless images over Miami-Dade County. Our emphasis on clear sky data aimed to maintain relatively comparable intra-urban heat variability, meaning we could fairly compare different locations using cloudless observations and typically capture hotter conditions for heat-related studies.”
The MODIS instrument on Aqua scans Earth in 2,300-kilometer-wide swaths, which means there’s variability in the track Aqua took over or near Miami and the subsequent angle at which the area was scanned over the years. The MODIS view angle can be as large as 130-degrees, and measurements from the edges of its view can be distorted by atmospheric attenuation and other factors. This variation can lead to differing measurements of the same areas.
“Using a long-term composite strategy with data from 2003 to 2021 has mitigated this impact to some extent,” said Hu. “The long-term composite allows each pixel to be sampled at different view angles during Aqua overpasses. The long-term average allows us to use measurements of each location with different angles of observations, which decreases the chance of a large angular influence on our results.”
Uejio, Hu, and the rest of the HAQAST Environmental Justice Tiger Team performed the analysis in just a matter of months. After pairing the MODIS, census, and health data, the researchers found that, along with the 8% death rate, people who are poorer, primarily work outside, and who live in trailer parks or in areas that have the highest temperatures are most at risk of summer heat-related illness.
The county is now using the data along with information from community surveys, workshops, and other sources to create a Heat Action Plan designed to improve infrastructure, emergency response, and communication to protect citizens during extreme heat events.
“Miami-Dade County is already implementing its plan in 15 jurisdictions with the highest heat related illnesses,” said Uejio. “For example, they’re aligning the extreme heat and hurricane seasons and communications together, training emergency response teams to address extreme heat, installing more air conditioning in public housing, planting more trees, and working with the local weather service to lower heat advisory and warning thresholds.”
With this project, Miami-Dade County, Uejio, the HAQAST Environmental Justice Team, and NASA are working together to ensure that the people in South Florida who feel the heat the most won’t suffer the worst of its effects. In part through the support of funding from the agency’s Earth Science Division and unrestricted MODIS data provided by ESDS, the researchers now have a detailed understanding of how hot the warmest areas get and the populations of people who live and work in it. In the best use of science, the county is now turning the research results into policies, actions, and plans that help its residents to safely live in extreme, life-threatening heat.


