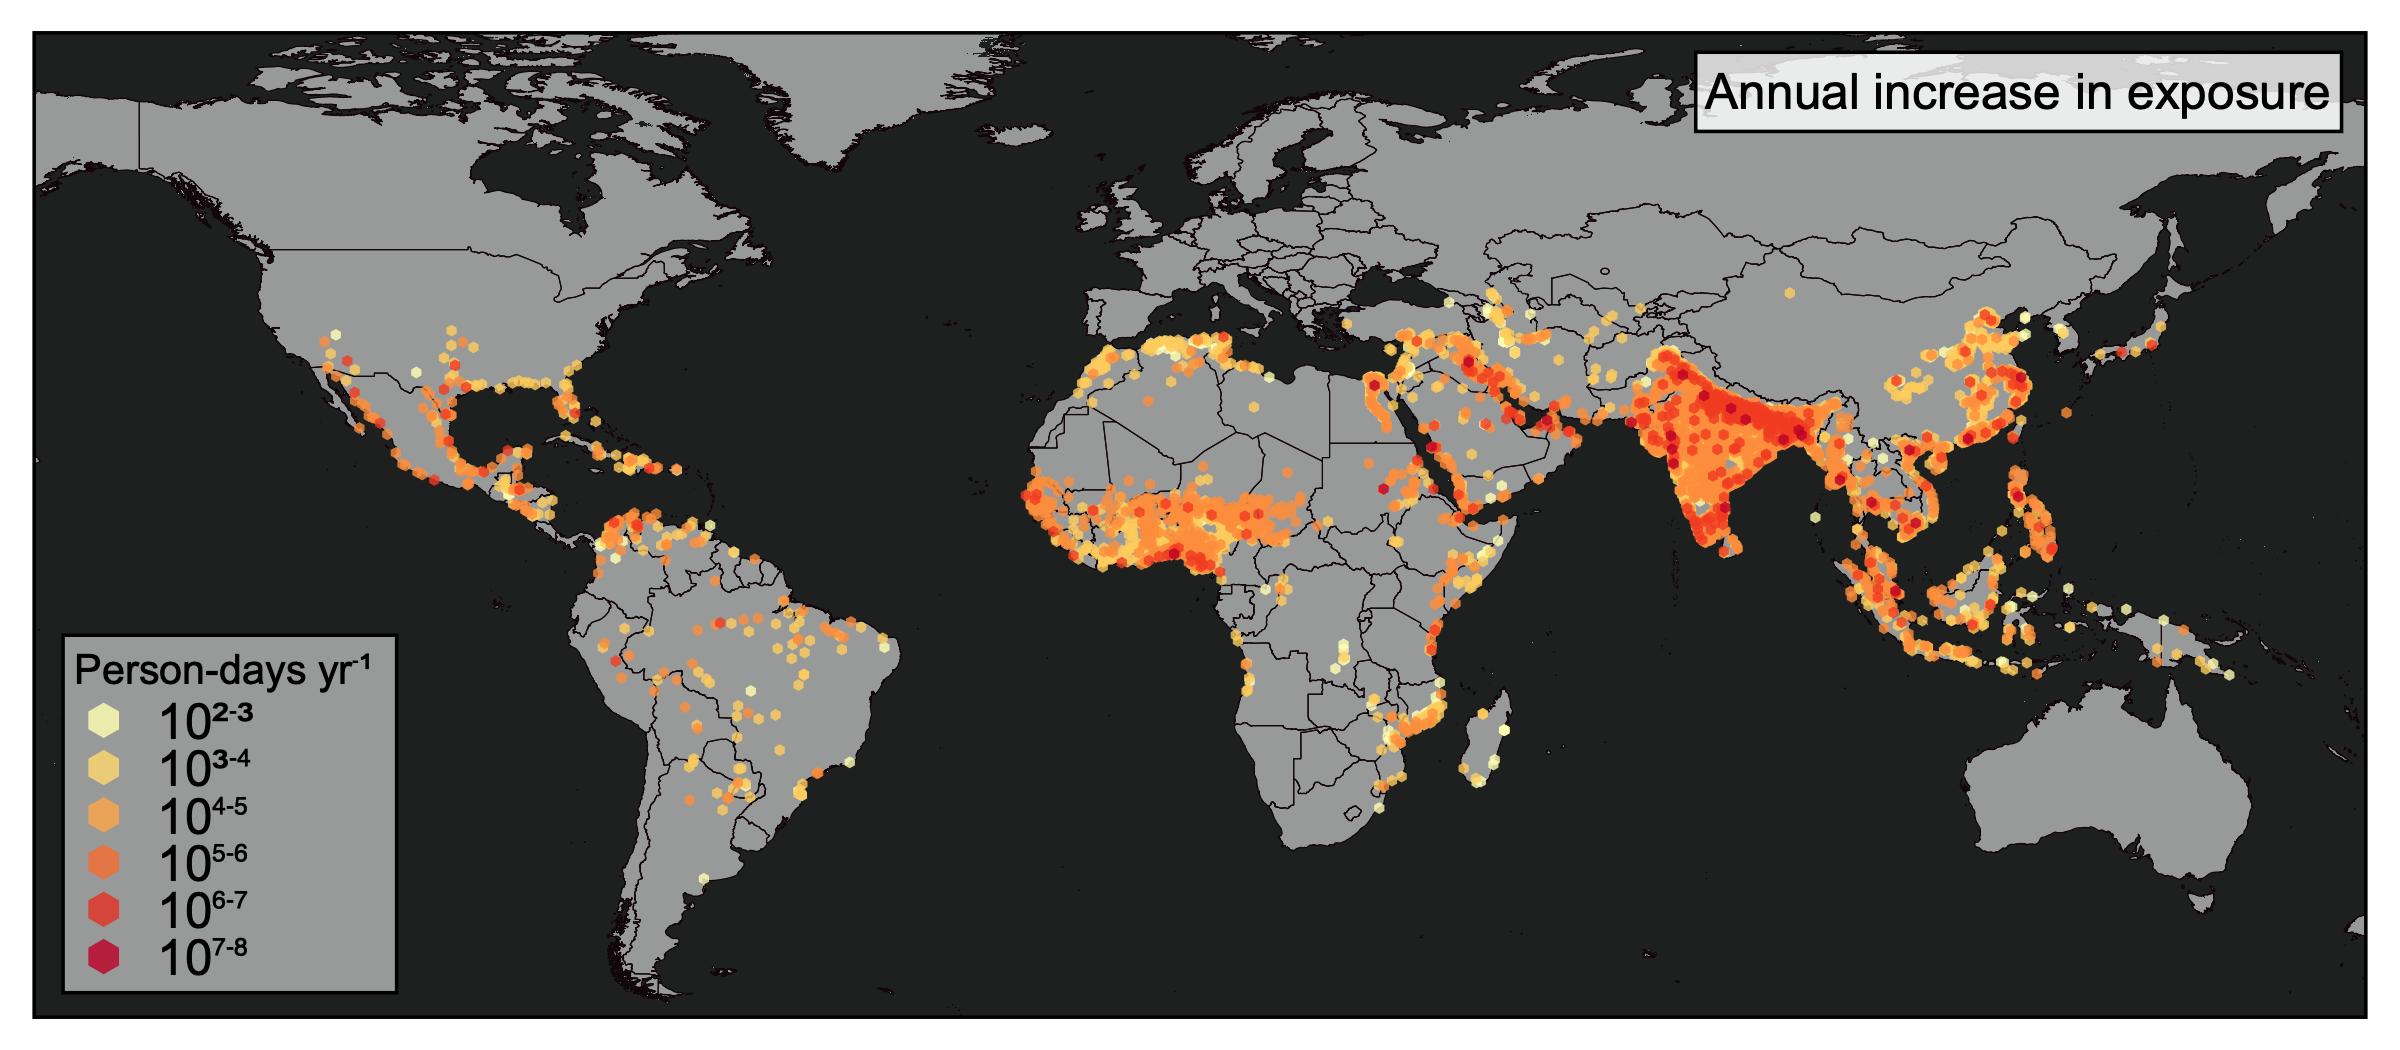
This webinar will introduce two new datasets released by NASA’s Socioeconomic Data and Applications Center (SEDAC): Global High Resolution Daily Extreme Urban Heat Exposure (UHE-Daily), v1 (1983-2016) and U.S. Social Vulnerability Index Grids, v1 (2000, 2010, 2014, 2016, and 2018). The UHE-Daily dataset is a global inventory of extreme heat events covering more than 13,000 urban settlements from 1983 - 2016 across five different extreme heat thresholds. It includes the number of people exposed to each heat event, as well as 34-year exposure trends. The U.S. Social Vulnerability Index Grids dataset contains gridded layers for the Centers for Disease Control and Prevention (CDC) Social Vulnerability Index (SVI) for the overall score from 15 variables and four sub-category themes (Socioeconomic, Household Composition and Disability, Minority Status and Language, and Housing Type and Transportation) based on Census tract-level inputs. The webinar will introduce the datasets and provide brief data discovery and data access tutorials in Python and QGIS.
Interested in receiving announcements for upcoming webinars? To sign-up, send an email to: earthdatawebinars-join@lists.nasa.gov – leave the subject and body of the email blank.
