Tropical Cyclones

Tropical Cyclones RSS Feed
Image
Suomi NPP/VIIRS true color image of Hurricane Maria acquired on September 24, 2017, as the storm moved off the U.S. East Coast. Credit: NASA Worldview.

Tropical cyclones are one of the biggest threats to life and property. As defined by the World Meteorological Organization (WMO), a tropical cyclone is a rotating storm originating over a tropical ocean basin that has a low pressure center (the eye). The diameter of a tropical cyclone is typically 124 to 311 miles (200 to 500 km), but can be as large as 621 miles (1,000 km).

NASA's Earth Science Data Systems (ESDS) Program provides unrestricted access to data that can be used to monitor tropical cyclones as they develop and move across the ocean, such as true color imagery acquired by the Visible Infrared Imaging Radiometer Suite (VIIRS) aboard the joint NASA/NOAA Suomi National Polar-orbiting Partnership (Suomi NPP) satellite that can be interactively explored using the NASA Worldview Earth science data visualization tool. Data providing measurements of rainfall, cloud top temperature, and other variables for assessing storm strength and movement can be discovered and downloaded using NASA Earthdata Search.

Earth observation data are vital in planning for and dealing with the many hazards from tropical cyclones, such as storm surge, flooding, extreme winds, tornadoes, and lightning. Over the past 50 years, tropical cyclones have killed more than 779,000 people and caused more than $1.4 trillion in economic losses worldwide, according to the WMO.

Image
The 14 named 2022 Atlantic tropical storms included three hurricane landfalls along the coast of the U.S. mainland: Ian (two separate landfalls) and Nicole. Credit: NOAA.

The 2022 Atlantic hurricane season produced 14 named storms (winds of 39 mph or greater), of which eight became hurricanes (winds of 74 mph or greater) and two intensified to major hurricanes with winds reaching 111 mph or greater. An average hurricane season has 14 named storms, seven hurricanes and three major hurricanes.

According to the annual Atlantic hurricane season forecast produced by Colorado State University (CSU) and updated on August 3, 2023, the 2023 season is forecast to be above-average, with 18 named storms, 9 hurricanes, and 4 major hurricanes.

Terminology for these massive storms differs depending on the ocean basin in which they form:

  • Hurricane: Storms forming in the Caribbean Sea, the Gulf of Mexico, the North Atlantic Ocean, and the eastern and central North Pacific Ocean.
  • Typhoon: Storms forming in the western North Pacific Ocean.
  • Cyclone: Storms forming in the Bay of Bengal and Arabian Sea.
  • Severe Tropical Cyclone: Storms forming in the western South Pacific and southeast Indian Ocean.
  • Tropical Cyclone: Storms forming in the southwest Indian Ocean.

Cyclones Data Pathfinder

The Earthdata Tropical Cyclones Data Pathfinder directs users to NASA datasets that can aid in pre-storm, near real-time, and post-storm assessment. The Data Pathfinder also provides access to tools and applications for discovering, visualizing, and working with NASA Earth Observing System Data and Information System (EOSDIS) data related to tropical cyclones.

Worldview and the Worldview Image of the Week Archive

The NASA Worldview imagery mapping and data visualization application gives users the ability to browse and view natural events, including tropical cyclones, as they are seen by sensors aboard NASA’s constellation of Earth observation satellites. Natural event metadata used in Worldview are curated and provided by NASA's Earth Observatory Natural Event Tracker (EONET) API. In addition, the Worldview Image of the Week collection showcases a wide range of Worldview imagery and data. Worldview uses NASA's Global Imagery Browse Services (GIBS) to rapidly retrieve imagery for interactive browsing.

The Suomi NPP/VIIRS Worldview image below is a true color image of Hurricane Maria acquired on September 24, 2017. Hurricane Maria was a Category 5 hurricane, the strongest storm designation on the Saffir-Simpson Hurricane Wind Scale, and had winds as high as 174 mph. The storm devastated the northeastern Caribbean, particularly the islands of Dominica, Saint Croix, and Puerto Rico. Click anywhere on the image to interactively explore it with full functionality at Worldview.

Image
VIIRS true color image of Hurricane Maria from Worldview.


Articles and Data User Profiles

Image
Three panel image showing headshots of three Data User Profile subjects.
Left to right: Dr. Anna Wilson, Dr. Margaret "Maggie" Glasscoe, and Dave Jones use NASA Earth science data in their work and research related to tropical cyclones. Read more in their Data User Profiles. Credit: NASA EOSDIS.

Along with data available through Earthdata Search and NASA's Distributed Active Archive Centers (DAACs), many Earthdata articles provide a wealth of background about tropical storms, missions collecting data related to these storms, and how these data are being applied. Data User Profiles show how individual scientists and researchers are using EOSDIS data to explore the science behind these storms.

Relevant Articles

Hurricane Ida 2021
Hurricane Ida struck southeast Louisiana as a powerful Category 4 storm on Sunday, August 29, 2021—the 16th anniversary of Hurricane Katrina’s landfall in 2005. This article by the NASA Earth Applied Sciences Disasters program area describes the agency's efforts to monitor this storm and its impacts.

Super Typhoon Rai
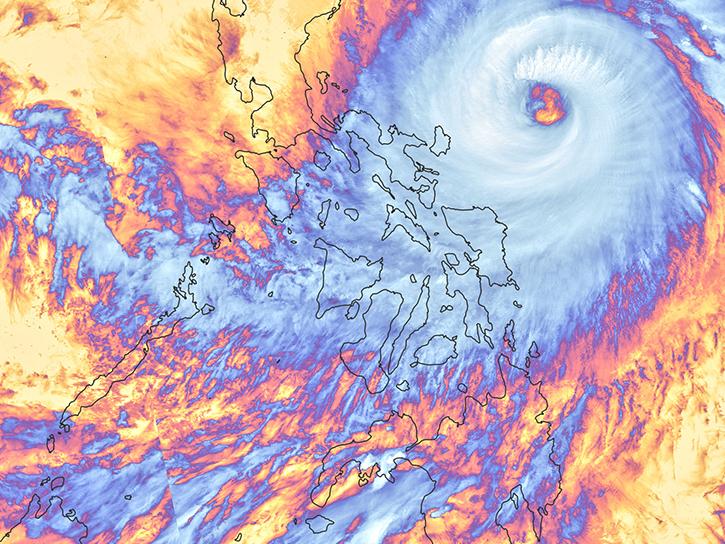
Typhoon Rai crossed the southern and central Philippines on December 16, 2021, having intensified to Category 5 strength just hours before landfall. Locally named Odette, the storm was one of the strongest recorded on Earth in 2021 and the sixth to reach Category 5. This Earth Observatory Image of the Day provides additional information about this immense storm.

Tropical Storm Elsa 2021
Tropical Storm Elsa was the third tropical storm system of the 2021 Atlantic hurricane season to make landfall in the continental U.S. In its role to aid risk reduction, response, and recovery for hurricanes and other disasters, the NASA Earth Applied Sciences Disasters program area activated efforts to monitor the storm.

Using NASA Earth Observations to Investigate Land Cover, Shoreline Change, and Sediment Transport in St. Joseph Peninsula after Hurricane Michael
T.H. Stone Memorial St. Joseph Peninsula State Park experienced significant damage from Hurricane Michael in 2018, the first Category 5 hurricane to hit the contiguous U.S. since 1992. NASA DEVELOP partnered with the Florida Department of Environmental Protection (DEP) from September to November 2021 to determine the overall impact of Hurricane Michael on land cover and shoreline change by using NASA Earth observations.

Webinars

NASA Earthdata Webinars span the Earth science disciplines and are designed to help users learn about NASA Earth science data, services, and tools and show users how to work with these resources.

Data Recipes and Tutorials

Data recipes are step-by-step instructions for using and working with Earth science data, information, tools, and services. Tutorials cover many different data products across the Earth science disciplines and different data discovery and data access tools, including programming languages and related software.

Additional Resources

Image
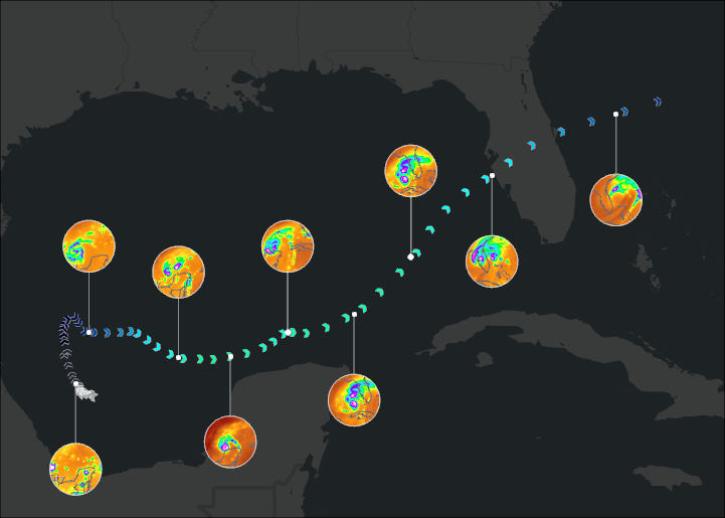
This interactive StoryMap from the NASA Disasters Mapping Portal shows data products and visualizations used to support response and recovery for Hurricanes Eta and Iota in 2020. Credit: NASA.

The Disasters program area of NASA’s Earth Science Applied Sciences Program uses Earth-observing data and applied research to improve the prediction of, preparation for, response to, and recovery from hurricanes and other disasters around the world. One resource they provide is the NASA Disasters Mapping Portal, an online interface for viewing, analyzing, and downloading the latest near real-time and disaster-specific products in Geographic Information Systems (GIS) format.

The Mapping Portal provides many resources for hurricane support, including information on past disasters to which NASA responded, near real-time data products, interactive StoryMaps, and more. The Disasters program has also developed a catalog of imagery and data products used in previous hurricane seasons by the disasters management community. Although not an exhaustive list, this information serves as a starting point for the use of available NASA science products.

NASA's Hurricanes and Tropical Storms landing page provides Hurricane Archives dating back to 2005 along with other NASA storm-related data. NASA's Hurricanes and Tropical Cyclones Image Gallery provides a wealth of storm images acquired from the International Space Station and other sources, while NASA's Hurricanes and Tropical Cyclones Video Gallery provides links to numerous videos about tropical storms and how NASA Earth science data are used to study, analyze, and track them. In addition, a StoryMap by NASA's ArcGIS DAAC collaboration shows how tropical storms can be observed using NASA geographic information system (GIS) data.

The Global Precipitation Measurement (GPM) Extreme Weather News page provides an archive of hurricane and tropical storm analysis dating back to 2002, using precipitation data and imagery collected by the joint NASA/Japan Aerospace Exploration Agency GPM and Tropical Rainfall Measuring Missions (TRMM). GPM also provides a variety of precipitation visualization tools and data products that can be used to study tropical cyclones and support storm response.

Finally, NASA's Scientific Visualization Studio has numerous products related to hurricanestropical storms, and cyclones; NASA's Earth Observatory also has many stories related to hurricanestropical storms, and cyclones.

Sub-Topics

You Might Also Be Interested In

Filter By

Content type
Black Marble Nighttime Blue/Yellow Composite (Day/Night Band) of Houston, Texas on July 9, 2024 showing reduced city lights due to power outages caused by Hurricane Beryl. Image from the VIIRS instrument aboard the joint NASA/NOAA NOAA-20 satellite
Worldview Image of the Week
Clean Infrared image of Hurricane Beryl approaching Jamaica on 3 July 2024 at 11:00 UTC from the ABI instrument aboard the GOES-East satellite
Worldview Image of the Week
Tropical Cyclone Jasper crosses over Queensland in Australia on 13 December 2023 from the VIIRS instrument aboard the joint NASA/NOAA Suomi NPP satellite overlaid with IMERG Precipitation Rate
Worldview Image of the Week
Hurricane Otis making landfall near Acapulco, Mexico on 25 October 2023 from the ABI instrument aboard the GOES-East satellite
Worldview Image of the Week
Typhoon Koinu over southern Taiwan on 4 October 2023 from the VIIRS instrument aboard the joint NASA/NOAA Suomi NPP satellite
Worldview Image of the Week
True color image of large white clouds moving up the U.S. East Coast
Worldview Image of the Week