Earth data gathered from the land, sea, and sky are ultimately about details pertaining to the world we live in. These data help us understand topics such as seasonal fires across the agricultural lands of Africa, the role of the ocean in generating oxygen and storing carbon, and how we can precisely measure changes in sea level. However, getting the full picture of what Earth science findings mean for humanity often requires tying the results to the global distribution of human population and economic activities. To achieve this, we need data related to human activities; we need socioeconomic data.
Socioeconomic data describe the location of populations and the well-being, living conditions, and financial situation of individuals, communities, and subgroups. These data add the who to the scientific questions of what, where, when, why, and how. Who is most impacted by extreme events? Who needs to plan for changing agricultural conditions? Who needs to strengthen buildings and building codes?
These data are particularly important for NASA and other organizations working to address environmental justice concerns. Poor and vulnerable communities around the world face environmental challenges such as poor air and water quality, sea level rise, and extreme heat, and have the fewest resources and options to deal with them. Socioeconomic data are key to identifying, assessing, and designing ways to mitigate these challenges.
NASA offers socioeconomic data freely and openly through the Socioeconomic Data and Applications Center (SEDAC), one of NASA's Distributed Active Archive Centers (DAACs). SEDAC is managed by the Center for International Earth Science Information Network (CIESIN) at Columbia University in Palisades, New York, and offers an array of data, interactive maps, and tools across a range of themes including agriculture, governance, health, and poverty.
Dr. Alex de Sherbinin is the SEDAC manager and an expert in the human aspects of global environmental change and geospatial data applications, integration, and dissemination.
"SEDAC has many types of data—including easy-to-use spatial data on population distribution, poverty, and air pollution levels, as well as [data] on other environmental conditions—that are available for people to use in the context of environmental justice and human-environment related research," said de Sherbinin.
Playing Nicely with Data

Socioeconomic data generally are available in tabular and vector formats. SEDAC makes socioeconomic data easier to use by compiling and standardizing data across multiple sources and providing them in formats that are more easily integrated with Earth science satellite data. For Earth science satellite data, "this typically means converting data from vector to raster or gridded formats that play nicely with the remote sensing data," said de Sherbinin.
A prime example is the U.S. Census Grids dataset that includes population and housing counts and a wide variety of socioeconomic characteristics. These gridded datasets transform irregularly shaped census tract, block, and block group boundaries into a regular surface—a raster grid—for faster and easier analysis.
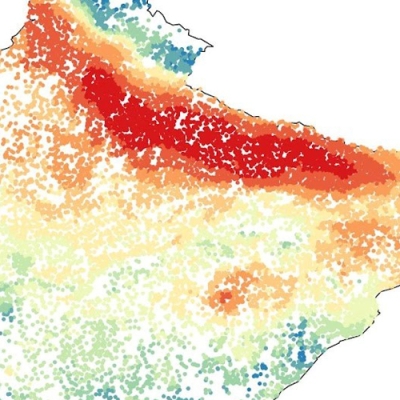
On a world-wide scale, the Global Gridded Relative Deprivation Index (GRDI) characterizes the relative levels of multidimensional deprivation and poverty in each 30 arc-second (~1 km) pixel, where a value of 100 represents the highest level of deprivation and a value of 0 the lowest. The GRDI is built from sociodemographic and satellite data inputs that were spatially harmonized, indexed, and weighted into six main components to produce the final index raster.
"It's a pretty unique dataset," said de Sherbinin. "There are other groups doing this kind of thing, but they tend to do it only for Africa or low-income countries. There's scientific interest to know how these things vary in other parts of the world as well."

Researchers, including NASA scientists, use socioeconomic data to show the impact of environmental events, processes, and phenomena on people and the places where they work and live.
On such example is a joint study SEDAC and Columbia University's International Research Institute for Climate and Society (IRI) completed that included the development of a tool to help identify flood-vulnerable communities in Houston and Harris County, Texas. The tool informs the equitable prioritization of flood resilience activities, focusing on communities most-at-need. To help create the tool, SEDAC developed a flood vulnerability index for the county that was based on SEDAC's Social Vulnerability Index Grids and that captures social and economic factors influencing flood vulnerability at the highest spatial resolution.
Easing Access to Socioeconomic Data
Accessing NASA's socioeconomic data is as easy as creating an Earthdata Login. An Earthdata Login provides users with the ability to receive news and notifications on data and services along with greater support for customizable interfaces, context awareness, saved preferences, and more. Once logged in, users can go to Earthdata Search to find the socioeconomic datasets they need and download them.
To increase interest in, access to, and use of of NASA's socioeconomic data, de Sherbinin gave a presentation on the topic during the Understanding Needs to Broaden Outside Use of NASA Data (UNBOUND) for the Environmental Justice Community Workshop in 2022. The aim of the workshop was to make NASA data, tools, and resources more usable and accessible to the environmental justice community by providing them with an opportunity to learn about and help improve the agency’s Earth science products and services.
"I used some of our web-based tools to show how you could create on-the-fly estimates of the numbers of people who might be exposed to environmental toxics. For example, [numbers of people living] near a manufacturing plant or brownfield site," said de Sherbinin.
Following the workshop, the NASA UNBOUND team released a report offering participant comments and recommendations for improving access to data, which SEDAC is using to further enhance the usability and applicability of its products.
NASA's support for SEDAC's work to supply researchers, decision-makers, and the public with socioeconomic data tailored for use with Earth observations demonstrates the agency's commitment to understanding and protecting the well-being of our home and humanity. In the current era of climate change, pandemics, economic disruption, conflict, and resource depletion (among other global concerns), the more we can learn about people and the places they live by using observations from the space above, the more we can do to benefit the life below.