image of ASTER instrument data
MODIS image of land surface data
VIIRS image of land surface data

LP DAAC

Land Processes Distributed Active Archive Center

NASA's Land Processes Distributed Active Archive Center (LP DAAC) ingests, processes, archives, documents, distributes, and supports NASA data products related to land processes collected by Earth observing instruments. LP DAAC provides data crucial to the investigation, characterization, and monitoring of biological, geological, hydrological, ecological, and related conditions and processes. In doing so, it promotes the interdisciplinary study and understanding of Earth’s integrated systems.


NASA's Earth Observing System (EOS) program comprises a series of polar-orbiting and low-inclination satellites designed to monitor and understand Earth systems through long-term global observations. LP DAAC archives data for a number of EOS missions.
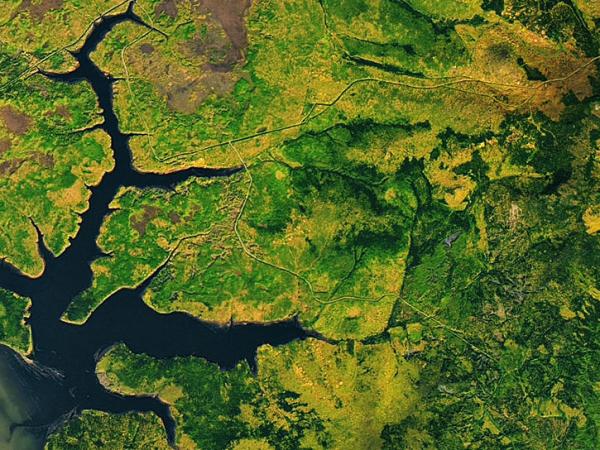
MODIS

The Moderate Resolution Imaging Spectroradiometer (MODIS) instrument is operating aboard both the Terra and Aqua spacecraft. It views the entire surface of the Earth every one to two days. MODIS data contribute to a range of land and water application areas including wildfire monitoring, temperature and emissivity changes, land surface change, vegetation and ecosystem dynamics, natural disasters, and agriculture studies. Learn more about MODIS data and view a list of MODIS products archived by LP DAAC.
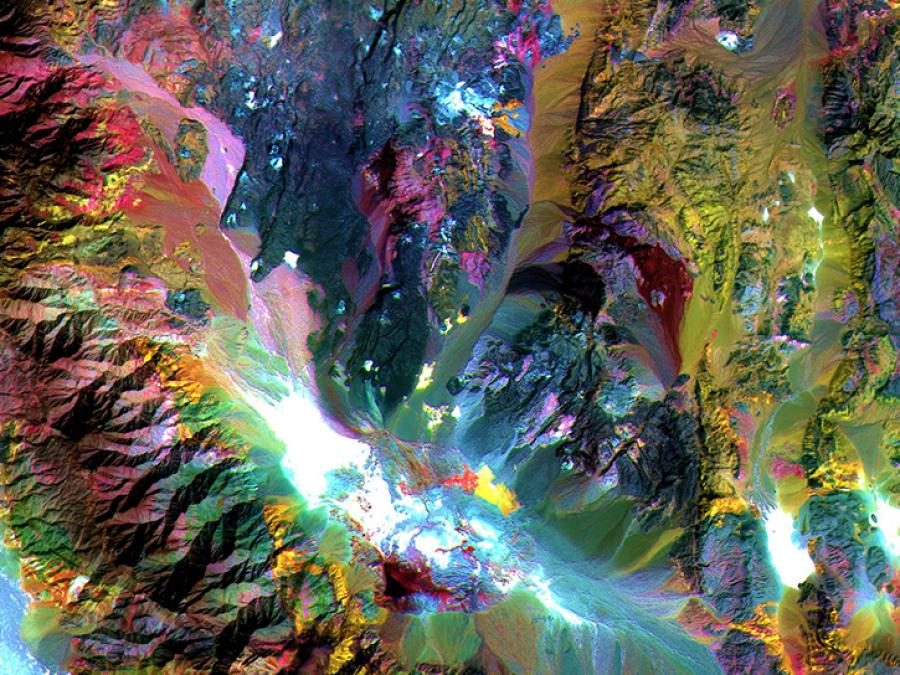
ASTER

Advanced Spaceborne Thermal Emission and Reflection Radiometer (ASTER) data contribute to a wide array of global change-related application areas including vegetation and ecosystem dynamics, hazard monitoring, geology and soils, hydrology, and land cover change. The ASTER instrument is aboard the Terra satellite and is taskable and able to be scheduled for on-demand data acquisition requests. For more information on tasking ASTER please visit the ASTER JPL Website and view a list of ASTER products archived by LP DAAC.
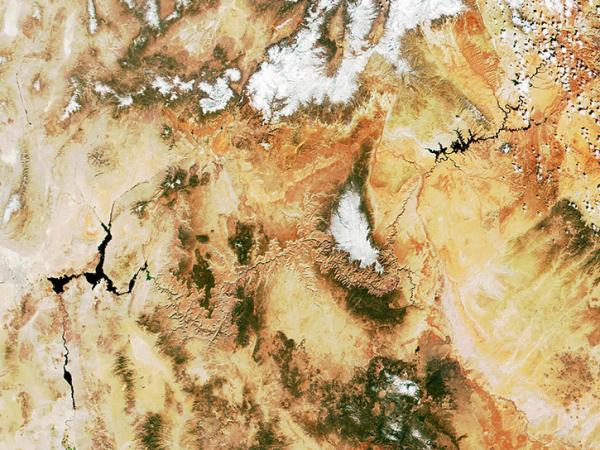
VIIRS

The Visible Infrared Imaging Radiometer Suite (VIIRS) is aboard both the NASA/NOAA Suomi National Polar-orbiting Partnership (Suomi NPP) and the NOAA-20 satellites. VIIRS observes the entire Earth’s surface twice each day, once during the day and once at night. VIIRS data contribute to a range of land and water application areas including wildfire monitoring, temperature and emissivity changes, land surface change, vegetation and ecosystem dynamics, natural disasters, and agriculture studies. Generated in a similar format to the Moderate Resolution Imaging Spectroradiometer (MODIS), VIIRS data products aim to provide continuity with the MODIS mission. Learn more about VIIRS data and view a list of VIIRS products archived by LP DAAC.

ECOSTRESS

Principal Investigator: Simon Hook, NASA/Caltech Jet Propulsion Laboratory

The ECOsystem Spaceborne Thermal Radiometer Experiment on Space Station (ECOSTRESS) is aboard the International Space Station (ISS) and measures the temperature of plants to better understand how much water plants need and how they respond to stress. ECOSTRESS addresses three overarching science questions: How is the terrestrial biosphere responding to changes in water availability? How do changes in diurnal vegetation water stress impact the global carbon cycle? Can agricultural vulnerability be reduced through advanced monitoring of agricultural water consumptive use and improved drought estimation? ECOSTRESS uses a multispectral thermal infrared radiometer to measure the surface temperature. The radiometer obtains detailed images of the Earth’s surface that can provide information on the temperature of an individual farmer’s field. Learn more on the ECOSTRESS website and view a list of ECOSTRESS products archived by LP DAAC.

EMIT

Principal Investigator: Robert O. Green, NASA Jet Propulsion Laboratory

The Earth Surface Mineral Dust Source Investigation (EMIT) instrument aboard the International Space Station (ISS) measures visible to short-wave infrared (VSWIR) wavelengths of the surface mineralogy of arid dust source regions via imaging spectroscopy. The data collected by the EMIT instrument will be used to map relative abundance of source minerals to advance our understanding of the current and future role of mineral dust in the radiative forcing (warming or cooling) of the atmosphere. Learn more about EMIT and view a list of EMIT products archived by LP DAAC.

GEDI

Principal Investigator: Ralph Dubayah, University of Maryland

The Global Ecosystem Dynamics Investigation (GEDI) is a full-waveform lidar instrument aboard the International Space Station (ISS) that produces detailed observations of the 3-dimensional structure of the Earth’s surface. GEDI precisely measures forest canopy height, canopy vertical structure, and surface elevation which enhances our understanding of global carbon and water cycle processes, biodiversity, and habitat. GEDI is the first of its kind to provide high resolution laser ranging observations optimized for lidar measurements of the Earth’s forests and topography at the highest resolution and densest sampling of any other lidar instrument in orbit. Data from GEDI is archived and distributed by the LP DAAC. Learn more about GEDI and view a list of GEDI products archived by LP DAAC.

HLS

Co-Investigators: Jeffrey Masek, NASA Goddard Space Flight Center and Junchang Ju, University of Maryland

The Harmonized Landsat Sentinel-2 (HLS) project is a NASA initiative to produce seamless, harmonized surface reflectance data from the Operational Land Imager (OLI) aboard the joint NASA/USGS Landsat 8 and Landsat 9 satellites and the Multi-Spectral Instrument (MSI) aboard Europe’s Copernicus Sentinel-2A, Sentinel-2B, and Sentinel-2C satellites. The aim is to produce seamless products with normalized parameters, which include atmospheric correction, cloud and cloud-shadow masking, geographic co-registration and common gridding, bidirectional reflectance distribution function, and spectral band adjustment. This will provide global observation of the Earth’s surface every 2-3 days with 30 meter spatial resolution. Applications that will benefit include agriculture assessment and monitoring, and phenology. View a list of HLS products archived by LP DAAC.

Future Missions

SNWG OPERA Disturbance

Investigator: Matt Hansen, University of Maryland

The Global Land Disturbance Mapping for JPL Observation Products for End-Users for Remote Sensing Analysis (OPERA) at the University of Maryland, is sponsored by NASA and developed at the Jet Propulsion Laboratory (JPL) in response to scientific gaps identified by the Satellite Needs Working Group (SNWG). The OPERA land Disturbance (DIST) product suite will provide near-global, per-pixel land surface change from Harmonized Landsat Sentinel-2 (HLS) scenes. The primary focus of the DIST product suite is to map vegetation cover loss along with general disturbance trends every 2–3 days with 30 meter spatial resolution. For more information on the OPERA DIST product suite, visit the DIST JPL product site.

VIIRS JPSS-2/NOAA-21

The Visible Infrared Imaging Radiometer Suite (VIIRS) is aboard the NOAA-21 satellite, which was launched on November 10, 2022. After its launch, JPSS-2 was renamed NOAA-21. JPSS-2 is the third VIIRS sensor, expanding upon the previously launched S-NPP and JPSS-1 sensors.VIIRS S-NPP and JPSS-1 products are distributed by the LP DAAC. VIIRS has 22 spectral bands ranging from 412 nm to 12 µm. There are 16 moderate-resolution bands (750m at nadir), 5 image-resolution bands (375m), and one day-night band (DNB). VIIRS observes the entire Earth’s surface twice each day, once during the day and once at night. VIIRS data contribute to a range of land and water application areas including wildfire monitoring, temperature and emissivity changes, land surface change, vegetation and ecosystem dynamics, natural disasters, and agriculture studies. Generated in a similar format to the Moderate Resolution Imaging Spectroradiometer (MODIS), VIIRS data products aim to provide continuity with the MODIS mission. Learn more about VIIRS data.

NASA’s Earth Science Program is dedicated to the advancement of Earth remote sensing and the scientific use of satellite measurements to expand our understanding of Earth systems. LP DAAC collaborates with the Making Earth System Data Records for Use in Research Environments (MEaSUREs) projects to facilitate the introduction of long-term, consistent, high-quality data records to the land remote sensing community.

GFCC

Principal Investigator: John Townshend, University of Maryland

The Global Forest Cover Change (GFCC) collection is derived from enhanced Landsat Global Land Survey (GLS) datasets and provides global coverage information on surface reflectance, water cover, and forest cover change.

Short NameKeywordSpatial Resolution (m)Temporal Resolution
GFCC30FCC.001Land Cover30Multi-Year
GFCC30SR.001Land Cover30Multi-Year
GFCC30TC.003Land Cover30Multi-Year
GFCC30WC.001Land Cover, Water30Other

GFSAD

Principal Investigator: Prasad Thenkabail, USGS

The Global Food Security-support Analysis Data (GFSAD) collection provides information on global croplands, including crop density and crop extent. The monitoring of global croplands is critical for policymaking and provides important baseline data that are used in many agricultural studies pertaining to water sustainability and food security.

Short NameKeywordSpatial Resolution (m)Temporal Resolution
GFSAD1KCD.001Cropland1000Multi-Year
GFSAD1KCM.001Cropland1000Multi-Year
GFSAD30AFCE.001Cropland30Multi-Year
GFSAD30AUNZCNMOCE.001Cropland30Multi-Year
GFSAD30EUCEARUMECE.001Cropland30Multi-Year
GFSAD30NACE.001Cropland30Multi-Year
GFSAD30SAAFGIRCE.001Cropland30Multi-Year
GFSAD30SACE.001Cropland30Multi-Year
GFSAD30SEACE.001Cropland30Multi-Year
GFSAD30VAL.001Cropland90Multi-Year

GLanCE

Principal Investigators: Mark Friedl, Curtis Woodcock, Pontus Olofsson, Thomas Loveland, and Zhe Zhu

The Global Land Cover Mapping and Estimation (GLanCE) data record is an annual product derived from Landsat 5, 7, and 8. This project provides high-quality maps of global land cover, land use, and land cover change at 30 meter spatial resolution annually from 2001 to 2019. These data provide the user community with land cover type, land cover change, metrics characterizing the magnitude and seasonality of greenness of each pixel, and the magnitude of change.

Short NameCollectionKeywordSpatial Resolution (m)Temporal Resolution
GLanCE30.001MEaSUREs GLanCELand Cover, Vegetation Indices (VI)30.0Yearly


LSTE

Principal Investigator: Simon Hook, Jet Propulsion Laboratory
Co-investigator: Kerry Anne Cawse-Nicholson, Jet Propulsion Laboratory

The Land Surface Temperature and Emissivity (LSTE) collection provides global LSTE coverage for common use in surface energy balance studies, land surface modeling, climate change modeling, and urban heat island studies.

Short NameCollectionKeywordSpatial Resolution (m)Temporal Resolution
CAM5K30CF.002MEaSUREs LSTEEmissivity5600.0Monthly
CAM5K30CF.003MEaSUREs LSTEEmissivity5600.0Monthly
CAM5K30CFCLIM.003MEaSUREs LSTEEmissivity5600.0Monthly
CAM5K30COVCLIM.003MEaSUREs LSTEEmissivity25000.0Monthly
CAM5K30EM.002MEaSUREs LSTEEmissivity5600.0Monthly
CAM5K30EM.003MEaSUREs LSTEEmissivity5600.0Monthly
CAM5K30EMCLIM.003MEaSUREs LSTEEmissivity5600.0Monthly
CAM5K30UC.003MEaSUREs LSTEEmissivity5600.0Monthly
CAM5K30UC.002MEaSUREs LSTEEmissivity5600.0Monthly
CAM5K30UCCLIM.003MEaSUREs LSTEEmissivity5600.0Monthly
GEOLST4KHR.002MEaSUREs LSTELand Surface Temperature (LST)4000.0< Daily
LEOLSTCMG30.002MEaSUREs LSTELand Surface Temperature (LST) Monthly
LEOLSTCMG30.001MEaSUREs LSTELand Surface Temperature (LST) Monthly

NASADEM

Principal Investigator: Sean Buckley, Jet Propulsion Laboratory

NASADEM extends the legacy of the Shuttle Radar Topography Mission (SRTM) by improving the digital elevation model (DEM) height accuracy and data coverage as well as providing several new data products. The improvements were achieved by reprocessing the original SRTM radar signal and telemetry data with updated algorithms and auxiliary data not available at the time of the original SRTM processing.

Short NameCollectionKeywordSpatial Resolution (m)Temporal Resolution
NASADEM_HGT.001MEaSUREs NASADEMElevation30.0Multi-Day
NASADEM_SC.001MEaSUREs NASADEMElevation30.0Multi-Day
NASADEM_SHHP.001MEaSUREs NASADEMElevation30.0Multi-Day
NASADEM_SIM.001MEaSUREs NASADEMElevation30.0Multi-Day
NASADEM_SSP.001MEaSUREs NASADEMElevation30.0Multi-Day

SRTM

Principal Investigator: Michael Kobrick, Jet Propulsion Laboratory

The NASA Shuttle Radar Topography Mission (SRTM) is a collaborative effort by NASA, the National Geospatial-Intelligence Agency (NGA), and the participation of German and Italian space agencies. This collaboration aims to generate a near-global digital elevation model (DEM) of Earth using radar interferometry. SRTM was the primary (and virtually only) payload on the STS-99 mission of the space shuttle Endeavour, which launched February 11, 2000, and flew for 11 days.

Short NameCollectionKeywordSpatial Resolution (m)Temporal Resolution
SRTMGL1.003MEaSUREs SRTMElevation30.0Multi-Day
SRTMGL1N.003MEaSUREs SRTMElevation30.0Multi-Day
SRTMGL3.003MEaSUREs SRTMElevation90.0Multi-Day
SRTMGL30.021MEaSUREs SRTMElevation1000.0Multi-Day
SRTMGL3N.003MEaSUREs SRTMElevation90.0Multi-Day
SRTMGL3S.003MEaSUREs SRTMElevation90.0Multi-Day
SRTMIMGM.003MEaSUREs SRTMElevation30.0Multi-Day
SRTMIMGR.003MEaSUREs SRTMElevation30.0Multi-Day
SRTMSWBD.003MEaSUREs SRTMElevation, Land Cover30.0Multi-Day

VCF

Principal Investigator: Matthew Hansen, University of Maryland

The Vegetation Continuous Fields (VCF) collection provides global vegetation continuous fields from Advanced Very High Resolution Radiometer (AVHRR) long-term data records version 4 (LTDR v4) from 1982 through 2016. Version 1 of this data product includes a time series of VCF data at 5600 m resolution containing information on percent of tree cover, non-tree vegetation, and bare ground.

Short NameCollectionKeywordSpatial Resolution (m)Temporal Resolution
VCF5KYR.001MEaSUREs VCFVegetation Continuous Fields (VCF)5600.0Yearly

VIP

Principal Investigator: Kamel Didan, University of Arizona

The Vegetation Index and Phenology (VIP) collection comprises 34 years of a consistent, global record of vegetation indices and landscape phenology. The VIP collections are based on MODIS, AVHRR, and Satellite Pour l'Observation de la Terre (SPOT) data inputs.

Short NameCollectionKeywordSpatial Resolution (m)Temporal Resolution
VIP01.004MEaSUREs VIPPhenology, Vegetation Indices (VI)5600.0Daily
VIP07.004MEaSUREs VIPPhenology, Vegetation Indices (VI)5600.0Weekly
VIP15.004MEaSUREs VIPPhenology, Vegetation Indices (VI)5600.0Multi-Day
VIP30.004MEaSUREs VIPPhenology, Vegetation Indices (VI)5600.0Monthly
VIPPHEN_EVI2.004MEaSUREs VIPPhenology, Vegetation Indices (VI)5600.0Yearly
VIPPHEN_NDVI.004MEaSUREs VIPPhenology, Vegetation Indices (VI)5600.0Yearly

WELD and GWELD

Principal Investigator: David Roy, Michigan State University; Zhang Hankui, South Dakota State University

The NASA-funded Web-enabled Landsat Data (WELD) project generated Landsat Enhanced Thematic Mapper Plus (ETM+) mosaics of the conterminous United States and Alaska from 2002 to 2012. The WELD products were developed specifically to provide consistent data that could be used to derive land cover, geophysical and biophysical products for regional assessment of surface dynamics, and to study Earth system functionality. The WELD data products were decommissioned on December 2, 2019.

Global WELD (GWELD) is an expansion of WELD data products on a global scale using Landsat 4 and 5 Thematic Mapper (TM) and Landsat 7 Enhanced Thematic Mapper Plus (ETM+) Collection 1 (Versions 3.0 and 3.1) and Collection 2 (Version 3.2) data. These global products provide monthly and annual data for terrestrial non-Antarctic locations for six 3-year epochs that occur every 5 years from 1985 to 2010. GWELD Version 3.0 data for the 2010 epoch is currently available. GWELD Version 3.1 data for the 2000, 1990, and 1985 epochs and Version 3.2 data for the 2005 epoch are also available. The 1995 epoch will be released in the future.

Short NameCollectionKeywordSpatial Resolution (m)Temporal Resolution
GWELDMO.003MEaSUREs WELD and GWELDSurface Reflectance, Vegetation Indices (VI)30.0Monthly
GWELDMO.031MEaSUREs WELD and GWELDSurface Reflectance, Vegetation Indices (VI)30.0Monthly
GWELDMO.032MEaSUREs WELD and GWELDSurface Reflectance, Vegetation Indices (VI)30.0Monthly
GWELDYR.003MEaSUREs WELD and GWELDSurface Reflectance, Vegetation Indices (VI)30.0Yearly
GWELDYR.031MEaSUREs WELD and GWELDSurface Reflectance, Vegetation Indices (VI)30.0Yearly
GWELDYR.032MEaSUREs WELD and GWELDSurface Reflectance, Vegetation Indices (VI)30.0Yearly

Airborne Hyperspectral Reflectance Mosaic

Principal Investigators: John Gamon, Ran Wang, Hamed Gholizadeh, Jeannine Cavender-Bares, Christopher J. Helzer

Airborne Hyperspectral Reflectance datasets were acquired over various plots and sites: Cedar Creek Ecosystem Science Reserve (CCESR), Minnesota; Tallgrass Prairie Preserve, Oklahoma; Wood River, Nebraska; and Indian Cave State Park, Nebraska. These fine resolution mosaics can be used to better understand the optical diversity-biodiversity relationship and to investigate the spatial sensitivity of the optical diversity-biodiversity relationship at local scales.

Short NameCollectionKeywordSpatial Resolution (m)Temporal Resolution
AEHYP1TPPOK.001Airborne HyperspectralSurface Reflectance1Other
AEHYPCCMN300MM.001Airborne HyperspectralSurface Reflectance0.3Other
AEHYPICNE1M.001Airborne HyperspectralSurface Reflectance1Other
AEHYPWRNE1M.001Airborne HyperspectralSurface Reflectance1Other

ASTER GED

Principal Investigator: Glynn Hulley, Jet Propulsion Laboratory (JPL)

Using data from the Advanced Spaceborne Thermal Emission and Reflection Radiometer (ASTER) on NASA's Terra spacecraft, NASA/JPL derived the most detailed global emissivity map of the Earth, termed the ASTER Global Emissivity Database (GED).

Short NameCollectionKeywordSpatial Resolution (m)Temporal Resolution
AG100.003ASTER GEDElevation, Emissivity, Land Surface Temperature (LST), Vegetation Indices (VI)100Other
AG1km.003ASTER GEDElevation, Emissivity, Land Cover, Land Surface Temperature (LST), Vegetation Indices (VI)1000Other
AG5KMMOH.041ASTER GEDEmissivity, Vegetation Indices (VI)5600Monthly

GHISA

Principal Investigator:  Prasad Thenkabail, Itiya P. Aneece, Isabella Mariotto

The Global Hyperspectral Imaging Spectral-library of Agricultural crops (GHISA) is a comprehensive hyperspectral library of the world’s major agricultural crops (e.g., wheat, rice, barley, corn, soybeans, cotton, sugarcane, potatoes, chickpeas, lentils, and pigeon peas). Hyperspectral data for GHISA were acquired from spaceborne, airborne, and ground-based platforms.

Short NameCollectionKeywordSpatial Resolution (m)Temporal Resolution
GHISACASIA.001GHISACropland Seasonal
GHISACONUS.001GHISACropland Seasonal

G-LiHT

Principal Investigator: Bruce Cook

Goddard’s Light Detection and Ranging (LiDAR), Hyperspectral, and Thermal Imager (G-LiHT) was developed to simultaneously derive information about the composition, structure, and function of terrestrial ecosystems using a combination of airborne LiDAR, imaging spectroscopy, and thermal measurements.

Short NameCollectionKeywordSpatial Resolution (m)Temporal Resolution
GLCHMK.001G-LiHTCanopy Height, Lidar1Varies
GLCHMT.001G-LiHTCanopy Height, Lidar1Varies
GLDSMT.001G-LiHTCanopy Height, Elevation, Lidar1Varies
GLDTMK.001G-LiHTElevation, Lidar1Varies
GLDTMT.001G-LiHTElevation, Lidar1Varies
GLHYANC.001G-LiHTLidar1Varies
GLHYVI.001G-LiHTLidar, Vegetation Indices (VI)1Varies
GLLIDARPC.001G-LiHTLidar1Varies
GLMETRICS.001G-LiHTCanopy Height, Lidar, Surface Reflectance, Vegetation Indices (VI)15Varies
GLORTHO.001G-LiHTLidar0.3Varies
GLRADS.001G-LiHTLidar, Surface Radiance1Varies
GLREFL.001G-LiHTLidar, Surface Reflectance1Varies
GLTRAJECTORY.001G-LiHTElevation1Varies

Headwall Hyperspectral Reflectance Mosaic

Principal Investigator: John Gamon, Ran Wang

An imaging spectrometer on an airborne tram system collected images at 1-millimeter spatial resolution for 33 selected plots at the biodiversity (BioDIV) experiment at the CCESR LTER, Minnesota. The hyperspectral range and fine resolution of the data will assist researchers in studying biodiversity in this area. These findings can be used to guide future airborne studies in developing more effective large-scale biodiversity sampling methods.

Short NameCollectionKeywordSpatial Resolution (m)Temporal Resolution
HWHYPCCMN1MM.001HeadwallSurface Reflectance0.001Other

LGRIP30

Principal Investigator: Prasad Thenkabail

The Global Food Security-support Analysis Data (GFSAD) project provides the highest-known spatial-resolution Landsat-derived Global Rainfed and Irrigated area Product (LGRIP) at 30 meter spatial resolution for the nominal year 2015. The LGRIP product maps agricultural lands, calculates irrigated and rainfed areas, and performs accuracy assessment of the product.

Short NameCollectionKeywordSpatial Resolution (m)Temporal Resolution
LGRIP30.001LGRIPCropland, Land Cover, Water30Multi-Year
LGRIP30_L1_IRRI.002LGRIPCropland, Land Cover, Water30Multi-Year
LGRIP30_L1_RAIN.002LGRIPCropland, Land Cover, Water30Multi-Year
LGRIP30_L2_IRRI.002LGRIPCropland, Land Cover, Water30Multi-Year
LGRIP30_L2_RAIN.002LGRIPCropland, Land Cover, Water30Multi-Year
LGRIP30_L3.002LGRIPCropland, Land Cover, Water30Multi-Year

LPJ-EOSIM

Principal Investigator: Thomas Colligan

The Lund-Potsdam-Jena Earth Observation SIMulator (LPJ-EOSIM) model replicates biospheric processes to estimate how plants of different functional types obtain resources through photosynthesis and competition. The model estimates global wetland methane (CH4) emissions using simulated wetland extent and characteristics including soil moisture, temperature, and carbon content. The wetland CH4 flux data will be used to support the United States Greenhouse Gas Center (US GHG Center) and its mission to study natural GHG fluxes. A carbon dioxide (CO2) product is planned for the near future, along with the possibility of more data products containing biospheric variables such as gross primary production and net primary production.

Short NameCollectionKeywordSpatial Resolution (m)Temporal Resolution
LPJ_EOSIM_L2_DCH4E.001LPJ-EOSIMGreenhouse Gases (GHG), Methane (CH4)50000Daily
LPJ_EOSIM_L2_DCH4E_LL.001LPJ-EOSIMGreenhouse Gases (GHG), Methane (CH4)50000Daily
LPJ_EOSIM_L2_MCH4E.001LPJ-EOSIMGreenhouse Gases (GHG), Methane (CH4)50000Monthly
LPJ_EOSIM_L2_MCH4E_LL.001LPJ-EOSIMGreenhouse Gases (GHG), Methane (CH4)50000Monthly

LPJ-PROSAIL

Principal Investigator: Bryce Currey

The LPJ-PROSAIL global simulated imaging spectroscopy products are being developed to provide data analogs for the development of future spaceborne global imaging spectroscopy missions including NASA’s Surface Biology and Geology (SBG). The data products consist of simulated imaging spectroscopy data produced by the LPJ-PROSAIL model. The LPJ-PROSAIL model was developed by coupling LPJ, a dynamic global vegetation model, with PROSAIL, a canopy radiative transfer model. LPJ-PROSAIL will consist of multiple products containing dynamic surface reflectance, dynamic top-of-atmosphere radiance, and vegetation traits. The reflectance and radiance products will have a spectral range of 400 to 2500 nanometers (nm) with a spectral resolution of 10 nm at approximately 50 kilometer spatial resolution. Data will be available for each year from 2000 to present. Data availability within that timeframe will vary by product. Each granule will contain a full year of simulated monthly data. For more information visit the LPJ-PROSAIL website.

Short NameCollectionKeywordSpatial Resolution (m)Temporal Resolution
LPJ_L2_SSREF.001LPJ-PROSAILSpectroscopy, Surface Reflectance50000Monthly
LPJ_L2_SSREF.002LPJ-PROSAILSpectroscopy, Surface Reflectance50000Monthly

MuSLI

Principal Investigator: Mark Friedl

NASA’s Multi-Source Land Imaging (MuSLI) Land Surface Phenology (LSP) (MSLSP) provides a 30 m spatial resolution data product containing phenology timing metrics for North America. These data are useful for a wide range of applications including: ecosystem and agro-ecosystem modeling, monitoring of terrestrial ecosystems and their response to climate change and extreme events, as well as mapping land cover, land use, and land cover change.

Short NameCollectionKeywordSpatial Resolution (m)Temporal Resolution
MSLSP30NA.011MuSLIPhenology, Surface Reflectance, Vegetation Indices (VI)30Yearly

FUTURE Community

INCA

Principal Investigator: Josh Gray

NASA’s Indicator of National Climate Assessment (INCA) will provide a 500 meter spatial resolution, yearly data product that spans from January 2001 to December 2016; it will contain global phenology metrics based on Terra and Aqua Moderate Resolution Imaging Spectroradiometer (MODIS) data. This data product will provide a remote sensing-based land surface phenology climate indicator (LSP-CI) that supports the National Climate Assessment’s need for national scale, long-term monitoring of climate change impacts on ecosystems.

NASA's LP DAAC processes, archives, and distributes land data products to hundreds of thousands of users in the earth science community. Our land data products are made available and support the ongoing monitoring of Earth’s land dynamics and environmental systems to facilitate interdisciplinary research, education, and decision-making.

Process

Raw data collected from specific satellite sensors, such as ASTER aboard NASA’s Terra satellite, are received and processed into a readable and interpretable format here at the LP DAAC, while other data undergo processing in other facilities around the country before arriving to the LP DAAC to be archived and distributed to the public.

Archive

The LP DAAC continually archives a wide variety of land remote sensing data products collected by sensors onboard satellites, aircraft, and the International Space Station (ISS). The archive currently totals more than 3.5 petabytes of data, the equivalent of listening to 800 million songs, and distributes data to over 200,000 global users.

Distribute

All data products in the archive are distributed free of charge through NASA Earthdata Search and USGS EarthExplorer search and download clients. The LP DAAC supports tools and services, like the Application for Extracting and Exploring Analysis Ready Samples (AppEEARS), which allows users to transform and visualize data before download while offering enhanced subsetting and reprojecting capabilities.

Apply

Visit our Data in Action and Publications pages to learn about how LP DAAC data products have been utilized in various studies and applications of diverse disciplines; browse through our media wall to see pretty pictures of our data that you can share with friends and colleagues; interact with the land data science community on the Earthdata Forum; and discover a suite of tools and learning materials available to support a variety of research needs.

History

LP DAAC is located just outside of Sioux Falls, South Dakota, at the USGS Earth Resources Observation and Science (EROS) Center. On August 28, 1990, NASA and USGS established EROS as a Distributed Active Archive Center, or DAAC. A 65,000 square-foot addition to the building was constructed to support this new role for EROS, and was dedicated on August 19, 1996.

Our community of users includes scientists, researchers, federal, state, and local government, educational and commercial professionals, application users, and the general public.

CoreTrustSeal Certified Repository

We are proud to be a CoreTrustSeal Certified Repository. CoreTrustSeal is an international, community based, non-governmental, and non-profit organization promoting sustainable and trustworthhy data infrastructures.

CoreTrustSeal Logo