Jarrett Byrnes, University of Massachusetts, Boston
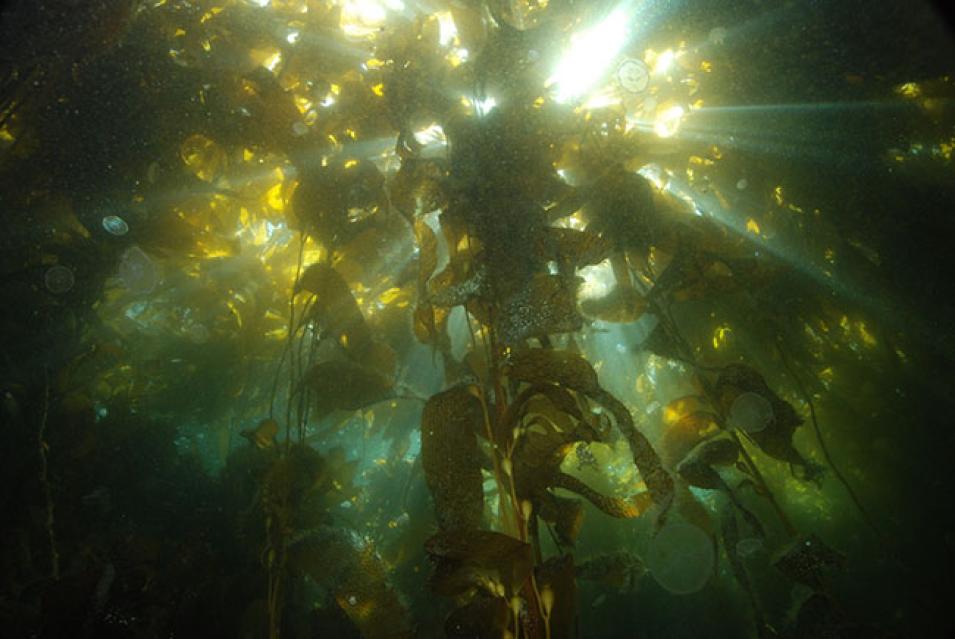
Macrocystis pyrifera, or giant kelp, is the world’s largest species of marine algae. The fast-growing seaweed is found in dense shoreline stands where it provides food and habitat for a variety of marine animals, including snails, shrimp, crabs, sea urchins, abalone, fish, and sea otters. In these kelp forest environments, giant kelp is a foundation species playing a role similar to that of trees in land forests.
Kelp forests account for about a quarter of coastline habitats and are among the most diverse and productive nearshore environments. Kelp helps protect our shorelines from storm erosion and is a source of alginate, an ingredient used in products from shampoo to ice cream. Because giant kelp is important for the health, resilience, and productivity of our coastlines, scientists who study the shoreline want to understand how kelp forests are changing over time. Satellites can help.
Just like the forests on land, kelp forests can be seen from space. In fact, kelp forests were identified in some of NASA’s earliest satellite imagery. So, scientists hoped they could visualize change in kelp forests over time using Landsat imagery.
The Landsat series of satellites photograph the entire surface of the earth every 16 days, and have been doing so since 1984. Landsat imagery could provide an ideal way to measure long-term changes in kelp forests but Landsat was not designed to see kelp. Kelp’s reflectance signature (the wavelength of light kelp reflects) is just at the edge of Landsat’s detection abilities. Because of this, a computer has difficulty detecting differences between kelp and the sun glinting off of a wave. The shapes and patterns of kelp forests are fairly easy for a person to distinguish, however, so a person can do a far more accurate job of identifying kelp than a computer.
Floating Forests is training citizen scientists to trace patches of kelp on Landsat imagery. So far, more than 20 years of imagery has been processed. The results are helping to uncover the history of giant kelp forests around the globe and the environmental factors that affect them.
Update October 2019
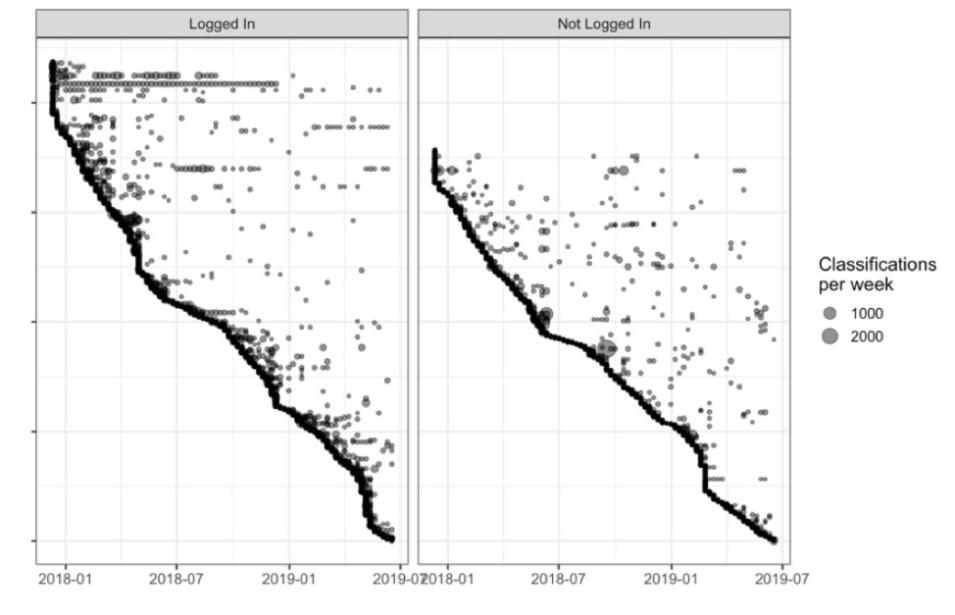
The Floating Forests project reached a milestone of 5,538 citizen scientists performing over 129,891 classifications on the site.
In the past year, these citizen scientists have helped develop a substantial dataset of classifications for the Falklands Islands (100% complete) which is being used for analysis of spatial and temporal trends in kelp distribution. By overlaying classifications on one another, Floating Forests has noticed strong trends in seasonality within the Falklands data with the austral winter showing low kelp abundance and a high spatial variation in this loss. The Southeast islands, however, show comparatively minimal loss. Results from the Falklands analysis are being posted online.
As the Falklands data is nearly complete, Floating Forests has begun a new project, “Kelp on the Edge.” It will quantify changes in range limits of kelps over the entire planet during the past 35 years.
Floating Forests has finished a version of the automated canopy area classification algorithm, and has applied this approach to a southern California dataset. This new method uses a combination of decision tree classification and spectral unmixing to identify kelp canopy.
Dr. Alison Haupt, one of the Floating Forest PIs, developed curricula in marine ecology for high school and college level classes. Dr. Haupt created a lab module that introduces students to kelp forests, the diverse communities that live in them, and the reasons they are important. At the college-level, students used the R programming language to answer their own questions and hypotheses. In its first year, these modules were implemented at California State University Monterey Bay in two Marine Ecology classes and in conjunction with a Marine Biology teacher at Santa Catalina High School.

