NASA Worldview Adds GeoColor Imagery from the joint NASA/NOAA GOES-East and GOES-West Satellites

GeoColor imagery’s quality, frequency, and interpretability will boost the amount of near real-time imagery available in Worldview, making it even more valuable to users.
author-share
Image
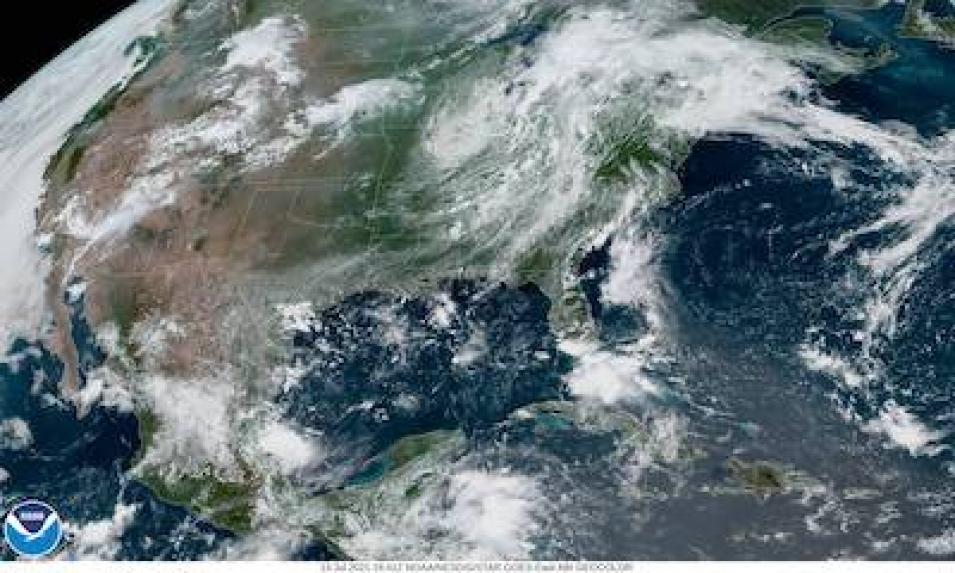
A daytime-scene GeoColor image of the continental United States (CONUS) from July 13, 2021. Credit: Colorado State University / CIRA.

NASA's Earth Observing System Data and Information System (EOSDIS) has announced the addition of Geostationary Operational Environmental Satellites (GOES) GeoColor imagery into Worldview, NASA’s imagery mapping and data visualization application offering the interactive browsing of nearly 1,000 global full-resolution satellite data imagery layers.

NASA’s Land, Atmosphere Near real-time Capability for EOS (LANCE), Global Imagery Browse Services (GIBS), and Worldview development teams have been collaborating with Dr. Steven Miller, Senior Research Scientist and Deputy Director at the Colorado State University’s Cooperative Institute for Research in the Atmosphere (CIRA), and his NOAA colleagues to incorporate GeoColor into Worldview, boosting the amount of near real-time imagery available in the application. Now, the wait is finally over.

GOES GeoColor imagery is a multispectral data product offering true-color imagery during the day and an infrared product at night. The application was developed by scientists at CIRA, NOAA, and the Naval Research Laboratory in Monterey. It is produced pseudo-operationally by Regional and Mesoscale Meteorology Branch of NOAA’s Center for Satellite Applications and Research (STAR).

GeoColor imagery is created with data from the Advanced Baseline Imager (ABIaboard the joint NASA/NOAA GOES-16 (or GOES-East) and GOES-17 (or GOES-West) satellites, the first two members of the GOES R-Series satellites launched in 2016 and 2018, respectively. The daytime true-color imagery is composed of ABI data from the blue, red, and near-infrared channels, enhanced to maximize the contrast between clear sky, clouds, and various surface types—providing a visually intuitive kind of imagery that is reminiscent of human vision. Since true-color imagery requires a green band that is not native to ABI, this component is synthesized using a lookup table that was built using data from the Advanced Himawari Imager (AHI) aboard the Japan Meteorological Agency’s Himawari-8 satellite. The table provides a relationship between green and nearby spectral bands shared by AHI and ABI. Then, the red, synthetic-green, and blue bands are combined to create the pseudo-true-color RGB product.

At night, the ABI’s window infrared channel is combined with the GOES-16 low cloud and fog product to identify both ice and liquid water clouds. These features are rendered semi-transparent, with opacity factors indexed to cloud thickness, and blended atop a static nighttime city lights background derived from the Day/Night Band of the Visible Infrared Imaging Radiometer Suite (VIIRS) instrument aboard the joint NASA/NOAA Suomi National Polar-orbiting Partnership (Suomi NPP) satellite.

The ABI currently produces images of the Western Hemisphere full disk image (10848 x 10848 pixels, with 1 km visible-band resolution at satellite sub-point) every ten minutes in its Mode 6 operations. It also provides a Continental United States (CONUS) domain image (dimension 3000 x 5000 px) every five minutes, and two mesoscale domains (1000 x 1000 px) every 60 seconds or one mesoscale-domain every 30 seconds. In Worldview, GeoColor imagery will be updated for the full-disk coverage every 10 minutes (ABI Mode-6 operations) and have a latency of approximately 40 minutes.

According to Dr. Miller, GeoColor is the culmination of years of behind-the-scenes scientific research and NASA-NOAA collaboration.
Image
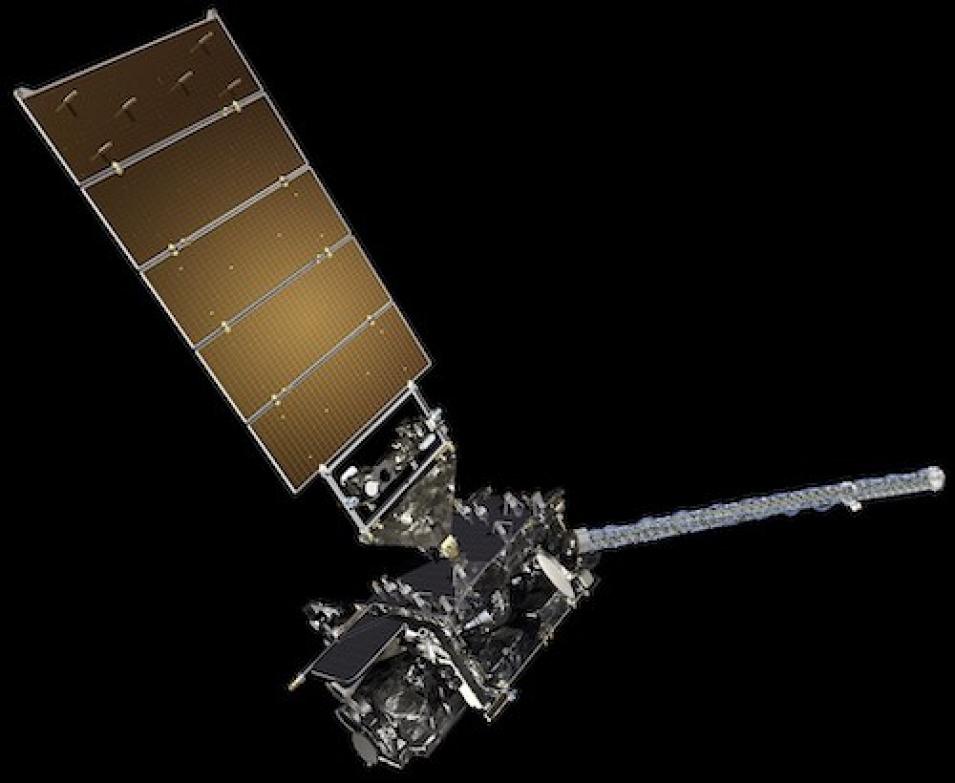
The joint NASA-NOAA GOES-16 satellite, the first of the GOES R-Series satellites launched in 2016. Credit: GOES-R.gov.

“GeoColor has NASA/NOAA synergy in its development heritage,” said Miller. “We first developed the synthetic green band approximation, used for the daytime true-color imagery of the ABI, based on data from the Moderate Resolution Imaging Spectroradiometer (MODIS) aboard NASA’s Terra and Aqua satellites, and later refined it using the AHI data. The quality of GeoColor is directly traceable to the early work with these NASA sensors.”

GeoColor’s quality, frequency, and interpretability has made it a popular product among scientists, forecasters, and the media.

“Since the colors of features in the daytime are what viewers expect them to be, the product requires little to no training, and also gives useful context to some of the more exotic false color imagery products. This has made it a popular imagery choice for social media,” Miller and his CIRA colleagues write in the GeoColor Quick Guide, available on the NOAA/STAR website.

Among GeoColor’s primary utilities are the distinction of daytime aerosol detection, as the high-quality true-color algorithm facilitates the identification of smoke, blowing dust, smog, and anything that has a unique color property that distinguishes it from meteorological clouds. Its other uses include nighttime cloud detection, because it can differentiate between low liquid water clouds and higher ice clouds at night, and rapid nighttime geo-referencing of weather hazards, as GeoColor’s city lights database allows for georeferencing by helping meteorologists and others determine whether clouds (such as fog) are affecting populated areas. GeoColor’s city lights background is created with essentially the same VIIRS data used to create NASA’s Black Marble data layer, which is already available in Worldview as part of the Earth at Night data category.

Satellites in geostationary orbit are extremely valuable for weather monitoring because they provide a constant view of the same surface area. Many times per hour, GOES-16 and other GOES satellites send information about clouds, water vapor, and wind, and this near-constant stream of information serves as the basis for most weather monitoring and forecasting.

Worldview already offers several data layers from the GOES-East, GOES-West, and Himawari-8 satellites, such as the Red Visible product, which can be used for analyzing daytime clouds, fog and fog-clear air boundaries, overshooting cloud tops, or cumulus clouds; the Clean Infrared Product, which provides cloud top temperature and information about precipitation; and the Air Mass RGB product, which facilitates the differentiation of air mass types (e.g., dry air, moist air, and so on). The addition of GeoColor imagery in Worldview will only make the interface even more valuable, says Miller.

“Currently, much of what Worldview demonstrates is from polar-orbiting satellites, which provide unique spectral capabilities and high spatial resolution, but are also more limited in their temporal refresh rates at the lower latitudes,” said Miller. “Including more geostationary-based information helps to put these high-quality snap-shots into context, and may even reveal new opportunities for data fusion. This will make Worldview that much more relevant to everyday users and enhance applications.”

Image
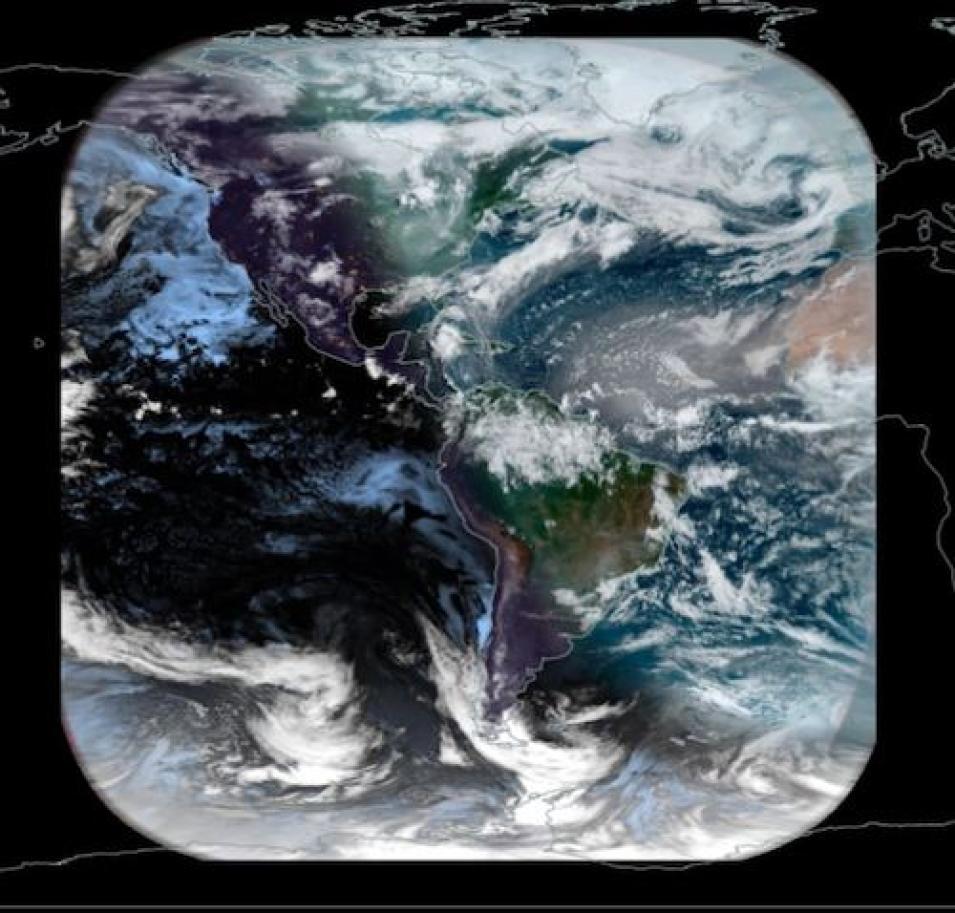
This screen capture of GeoColor imagery in Worldview shows both daytime (right side) and nighttime (left side) imagery. The GeoColor imagery in Worldview will be updated every 10 minutes and have a latency of approximately 40 minutes.

The inclusion of GeoColor imagery in Worldview also supports the findings of the 2017-2027 Decadal Survey for Earth Science and Applications from Space. Sponsored by NASA, NOAA, and the USGS, the 2017 survey, which helps shape the scientific priorities and guide agency investments into the next decade, called for increasing partnerships between the major Federal agencies serving earth science, including NOAA and NASA.

“Bringing GeoColor to Worldview showcases the potential synergy between NOAA operational assets and NASA’s wealth of research-grade and new-science sensors—revealing complementary information and perhaps paving the way for NASA-enabled technology demonstrations to find a long-term home on NOAA’s Geostationary Operational Environmental Satellites.”

The addition of GeoColor imagery to Worldview is just the beginning. In the future, data and imagery from new NASA sensors destined for geostationary orbit, such as the Tropospheric Emissions: Monitoring Pollution (TEMPO) instrument, the first ever space-based instrument to monitor air pollutants hourly across the North America from a geostationary satellite, and the Geosynchronous Littoral Imaging and Monitoring Radiometer (GLIMR) instrument, which will collect high-resolution observations of coastal ecosystems in such areas as the northern Gulf of Mexico, will be incorporated into Worldview as they come online.

“Data from these new geostationary-based sensors will add new dimensions of environmental information at the surface, throughout the atmospheric column, and importantly, in the very important dimension of time!” said Miller.

For more information:

To learn more about GeoColor imagery, go to the CIRA website.

To learn more about the joint NASA-NOAA GOES satellite program, visit the NOAA National Environmental Satellite Data and Information Service website.

To discover more near real-time data from NASA, see the LANCE website.

To load the GeoColor imagery in Worldview: 

Step 1: Load Geostationary Imagery

  • Click on “+ Add Layers” button at the bottom of the Layer List in Worldview: worldview.earthdata.nasa.gov
  • Select the “Featured” tab and select “Geostationary”; alternatively, type in “GeoColor” in the search box, and select "GeoColor (True Color (Day), Multispectral IR (Night)) GOES-East/ABI" or "GeoColor (True Color (Day), Multispectral IR (Night)) GOES-West/ABI".

Step 2: Set Up Timeline

  • Note the change in the timeline! You can now see the Year, Month, Day AND the time in Hours and Minutes Z (Zulu Time which is equivalent to UTC - Coordinated Universal Time) on the left side of the timeline.
  • To the right of the “Z” are the < > increment arrows. Click on “1 Day” above these to change the increment. There are several options - Year, Month, Day, Hour, Minute and Custom. Click on Custom and in the Custom Interval Selector box, change the increment to “10” and “Minute”. (This imagery is available in 10 minute increments starting at 00:00)
  • Click on “Day” on the right side of the timeline to change the timescale to “Minute” or “Hour”.

Step 3: View Geostationary Imagery and Step Through Time!

  • As there is about a 40 minute latency between the satellite acquisition and the time it takes for the data to be processed and available to view, click on the back arrow until imagery appears!

Step 4: Set Up Animation

  • To make it even easier to watch an event's progression, set up an animation!
  • Click on the Video Camera icon in the timeline.
  • Set the second date and time fields to 2021 JUL 21 00:30 Z; set the first date and time fields to 2021 JUL 21 02:20 Z.
  • Click on the "Play" button and check out the Dixie Fire in California on 21 July 2021 between 00:30 and 2:20 UTC.
  • Click on the "Create an Animated GIF" icon on the right to download an animated GIF of the animation.
Last Updated