With the launch of the Surface Water and Ocean Topography (SWOT) satellite in December 2022, scientists around the world are eager to finally see and work with its data. However, before the SWOT team makes the data available, it’s taking the first months of the mission to perform engineering checks of instrument performance, analyze the satellite’s initial measurements, tune its sensors, and gather feedback on the characteristics of the data from the research community. This approximately 6-month-long process is known as the commissioning, calibration, and validation phase, or Cal/Val, and ensures the data are of high quality and most useful to scientists when they are publicly released as fully validated data products in 2024.
Preparing for Oceans of Data
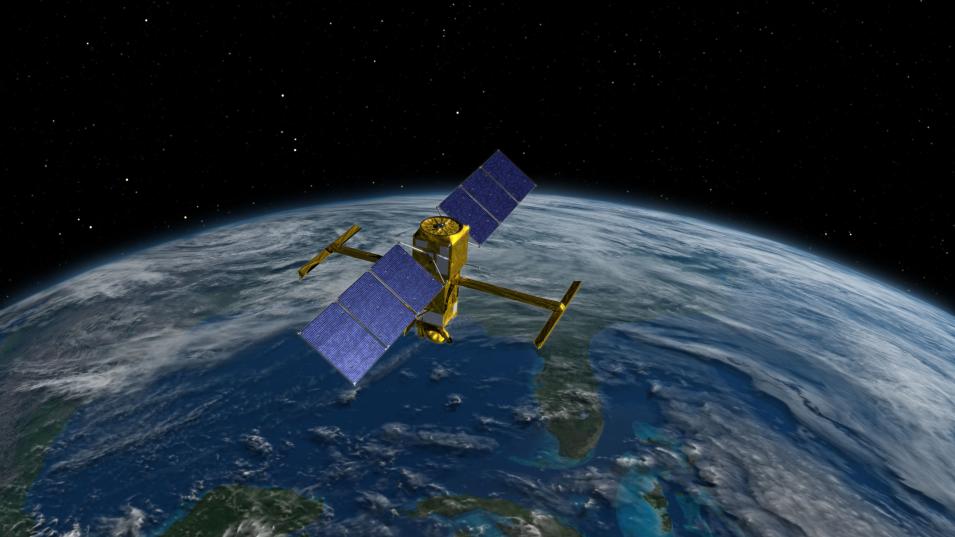
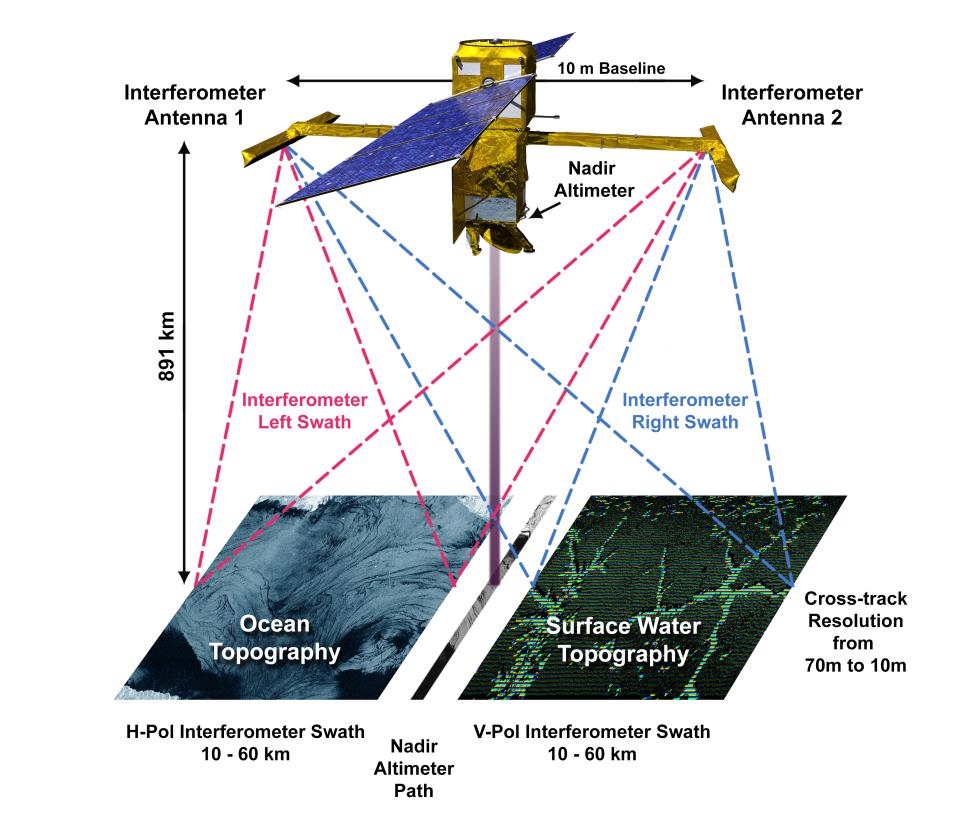
SWOT is a joint NASA/Centre National d'Etudes Spatiales (CNES, the French space agency) mission, with contributions from the Canadian and United Kingdom space agencies, to globally survey the topography of Earth's ocean and the elevation of surface waters, such as lakes, rivers, and wetlands. Data are collected using radar interferometry technology, which is a method of measuring surface topography by comparing radar scans of the same area that are acquired from slightly different viewing angles.
SWOT carries the new Ka-band radar interferometer (KaRIn) instrument, which features two radars that are spaced 10 meters (32 feet) apart. KaRIn’s complex scans will provide scientists with high-resolution ocean topography, land water elevation, and other data. The resolution of SWOT’s data will be as high as 100 meters (328 feet) per pixel, whereas conventional radar altimeters supply scans that can only provide detail down to several kilometers wide. SWOT’s data will provide critical information for assessing water resources on land, tracking regional sea level changes, monitoring coastal processes, and observing small-scale ocean currents and eddies. The spacecraft will generate 20 terabytes of data a day that will be available fully and without restriction (SMD Policy on Open Science). SWOT data also will be cloud-based for faster, easier access.
“SWOT’s high-definition view of Earth’s surface water will enable a myriad of water-related science and applications,” said SWOT Program Scientist Dr. Nadya Vinogradova-Shiffer. “For example, monitoring water storage in lakes and rivers to help inform water-management decisions, zooming onto rising seas to aid coastal resilience efforts, or discovering fine-scale ocean energetics in the open ocean to improve predictive capabilities of our climate models.”
Careful Calibration
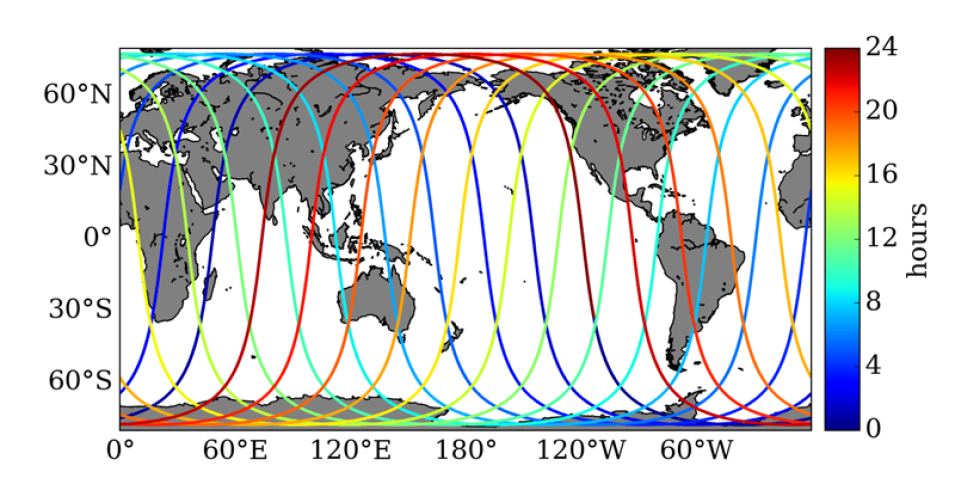
The first 90 days of the SWOT science mission are being flown in a fast-sampling phase that revisits specific areas once per day. This image shows a map of the 1-day repeat orbit that will occur during SWOT’s Cal/Val phase. The lines are color-coded by time within the 1-day repeat period. Credit: NASA/JPL.
In order for SWOT to provide these data, the mission team needs to make sure the spacecraft and its equipment are ready to gather and transmit the information. Project Scientist Dr. Lee-Lueng Fu is one of the experts heading up SWOT’s Cal/Val process.
“This is a first-of-its-kind pilot mission with a very complex instrument package,” said Fu. “We carefully built and tested SWOT before launch, but there are often differences in how instruments perform once in orbit. So, we’re being very careful and conservative in assessing instrument performance and data.”
For the Cal/Val period, NASA has positioned SWOT in a special slightly lower orbit that allows the satellite to pass over certain areas at least once a day. This fast-sampling orbit makes it easier for the mission team to differentiate between actual information signals and errors or noise in the satellite measurements.
The Cal/Val process begins with the engineering checkout and adjustments phase, which takes place January through March 2023. This phase basically consists of fully activating SWOT’s systems and making sure they’re working as expected.
Compare the Numbers
In spring 2023, the SWOT team plans to transition to in situ data validation that will continue through June. For this validation process, the satellite will make measurements over specific areas. These remotely-sensed measurements will then be compared with data gathered at the same time and location from a network of sensors in the ocean, along coastlines, and in other water bodies to see if the readings match. If the data from SWOT and the ground are similar, great! If not, the team will find explanations for the discrepancies and design solutions to bring the satellite-acquired data in agreement with surface-collected data.
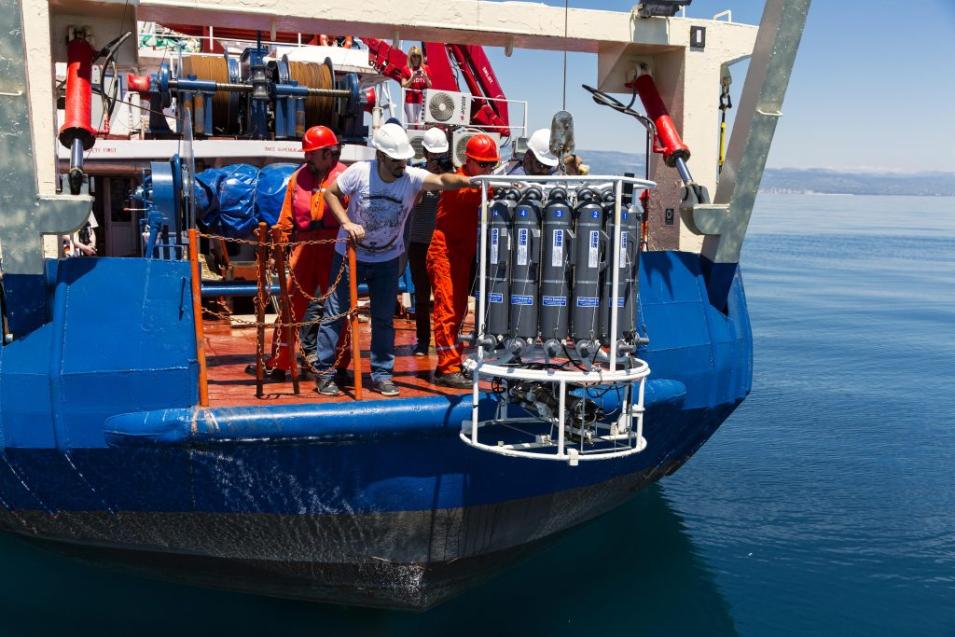
A key aspect of these data comparisons are measurements being provided by a global group of researchers called the SWOT ‘Adopt-A-Crossover’ Consortium. Researchers are leading projects to place sensors (such as buoys) and conduct ship-based campaigns to gather data from the fast-sampling orbit crossing locations all over the world. Researchers Dr. Francesco d’Ovidio and Dr. Kyla Druska are heading the consortium’s efforts. CNES Ocean Lead Dr. Rosemary Morrow and Hydrology Lead Dr. Jean-Francois Crétaux are conducting campaigns during the fast-sampling orbit crosses. “It’s an amazing international collaboration,” said Morrow. “We have brought together 18 international groups deploying in situ observations in the open ocean from ship-based campaigns. Plus, there are 11 coastal and estuary sites and 23 hydrology sites for lakes and rivers on different continents. Jean-Francois Crétaux will be in the field at Lake Issyk-Kul in Eastern Kyrgyzstan during the April-May period, and my team will be in the Southern Ocean site south of Tasmania in December 2023.”
Data Sneak Peek
Once the data comparison is complete and the science team agrees that KaRIn is collecting accurate data, the mission team will change SWOT’s orbit, raising it 50 kilometers (31 miles) to a 21-day orbit that will allow its 2 x 50 km swaths to scan a majority of the planet up to 78° in latitude. The SWOT team will also release pre-validated data to researchers who are interested in getting a sneak peek at the measurements and want to offer feedback on their quality and usability. The pre-validated data will be archived at NASA’s Physical Oceanography Distributed Active Archive Center (PO.DAAC), and notices of their availability will be posted on the PO.DAAC website and on other relevant websites, such as AVISO+.
An important community essential for sharing and evaluating the pre-validated data are the members of SWOT’s early adopters program. The early adopters are agencies, institutions, businesses, and other groups working in the public domain. They include the USGS, Stantec Inc., and Alexandria University in Egypt.
“Early adopter organizations are already staging their workforce and preparing to use SWOT’s data,” said Fu. “They will focus on using SWOT’s data for societal applications, such as understanding and managing coastal flooding. The early adopters will be vital for both evaluating the pre-validated data and communicating to users and industry that these data are available and their utility.” Early adopters and researchers who use the pre-validated data will be asked to provide feedback that will help the SWOT team determine how to best process the data for their uses.
Approving the Data
The last step in the Cal/Val process comes in late 2023 when the SWOT team convenes the Validation Workshop. This meeting will be the final opportunity for the science community to discuss the way SWOT’s data are to be gathered, processed, and distributed. As with the pre-validated data, SWOT’s fully validated data and products will be made available through PO.DAAC. The planned release of these data is in early 2024.
“The fact that SWOT's Cal/Val phase mobilized a large international community and boosted the development of new in situ platforms is a testament to the excitement and rigor of the scientific community to embrace and understand novel SWOT measurements,” said Vinogradova-Shiffer. “Validation of SWOT is thus becoming a global, communal effort—what a great way to kick off A Year of Open Science at NASA!”
The release of SWOT’s enormous amounts of data will open new eras in hydrologic and oceanographic research leading to scientifically important and societally vital discoveries, such as how coastlines are altering around the world. In no small way, researchers will be figuratively—and enthusiastically—swimming in oceans of data.


