Science Objectives
Here, Rishmawi and others (2021) look into the potential of extrapolating GEDI-derived forest structure attributes into annual (2019) 1 kilometer (km) maps of the conterminous United States (CONUS) for tree height (TH), canopy fraction cover (CFC), plant area index (PAI), and foliage height diversity (FHD) using GEDI Level 2B Canopy Cover and Vertical Profile Metrics data (GEDI02_B), Joint Polar Satellite System-1 (JPSS-1) National Oceanic and Atmospheric Administration – 20 (NOAA-20) Visible Infrared Imaging Radiometer Suite (VIIRS) Surface Reflectance data, and Suomi National Polar-Orbiting Partnership (Suomi NPP) VIIRS Land Surface Phenology (VNP22Q2) data.
Instruments and Techniques Used
First, the authors process nine VIIRS Moderate (M) bands to create consistent land surface phenology inputs to model a 3D canopy structure. The authors then extract canopy height (rh100), canopy cover, PAI, and FHD from the GEDI L2B product and filter to select the highest quality observations. The GEDI data were then mapped and aggregated into the VIIRS 1km sinusoidal grid system. The pairs of GEDI and VIIRS metrics were then split into calibration and validation datasets. The calibration data were used to train four random forest regression models to predict Canopy Height (CH), CFC, PAI, and FHD and ultimately to create wall-to-wall maps of those metrics over CONUS, minus water bodies.
Major Findings
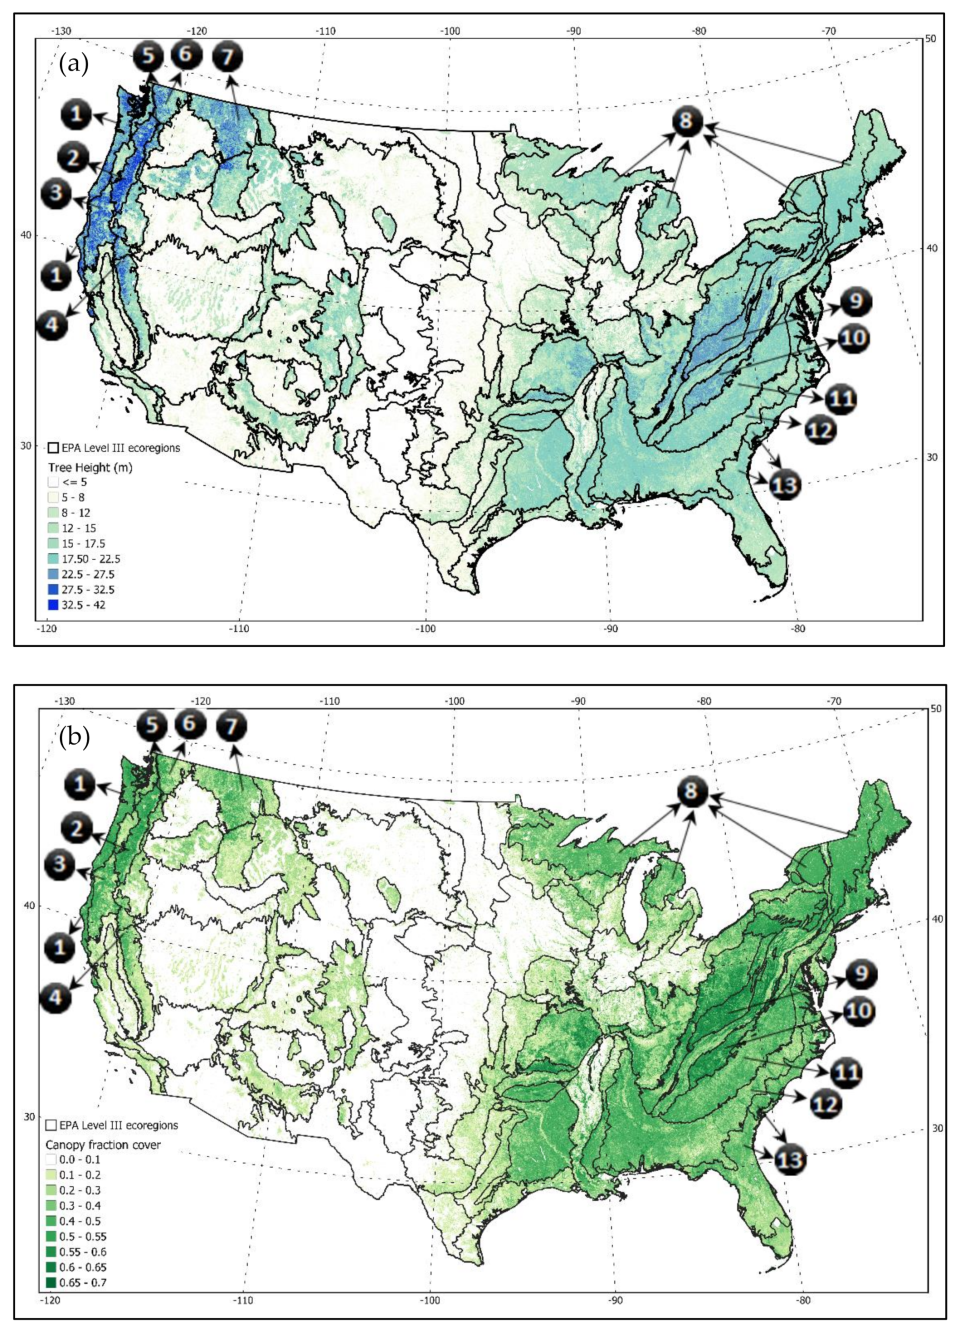
The VIIRS-modeled CH map found the tallest tree heights in the Klamath Mountains, the Cascades, and the Marine West Coast Forests, and a high CFC percentage in the Blue Ridge and Central Appalachians (see map). The authors found their method does provide a valid representation of the ability to produce 3D canopy structure maps across CONUS and can aid in future modeling of global forest biomass stocks. However, the authors note a robust accuracy assessment of the data still needs to be completed. In the future, the authors believe a study should be conducted to assess the potential of using the VIIRS 350-meter data as well.
References
Publication Reference
Author's note: Rishmawi and others (2021) used JPSS-1 (NOAA-20) Surface Reflectance data in their study. JPSS-1 (NOAA-20) Surface Reflectance data and additional data products will be available from the LP DAAC in the future. In addition, the authors used GEDI Level 2B Version 1 data, the LP DAAC recently released GEDI Level 2B Version 2 data, which can be found here: doi:10.5067/GEDI/GEDI02_B.002.
Image Reference
Image provided by the authors, Rishmawi and others (2021).


