Introduction
The Global Ecosystem Dynamics Investigation (GEDI) sounds like something out of a Star Wars story. As a matter of fact, the groundbreaking instrument has a lot in common with the popular movie series. First, it uses laser light, though not quite like the famous “lightsaber.” The GEDI instrument uses three lasers (two full power and one coverage) to create 3D maps of the Earth’s forests. Similarly, much like the blaster used in the science fiction series, the instrument works by firing a rapid laser pulse toward the surface of the Earth and then calculating the amount of time that laser pulse takes to return.
Science Objectives
The GEDI instrument, which operates between 51.6° S and 51.6° N latitude, collects data that can be used in a variety of applications, including forest management, habitat quality and biodiversity, carbon cycling, topography and surface deformation, water resources, weather prediction, and more. The instrument was specifically designed to answer several questions about the Earth. One of those questions aims to identify the structure and variety of forest that is best suited for at-risk species of animals. The calculation of plant area volume density (PAVD) can help researchers better understand the disbursement of various tree species and how they relate to bird ecology. Now that GEDI data are available at no cost from NASA’s LP DAAC, researchers can start using the data for their own studies.
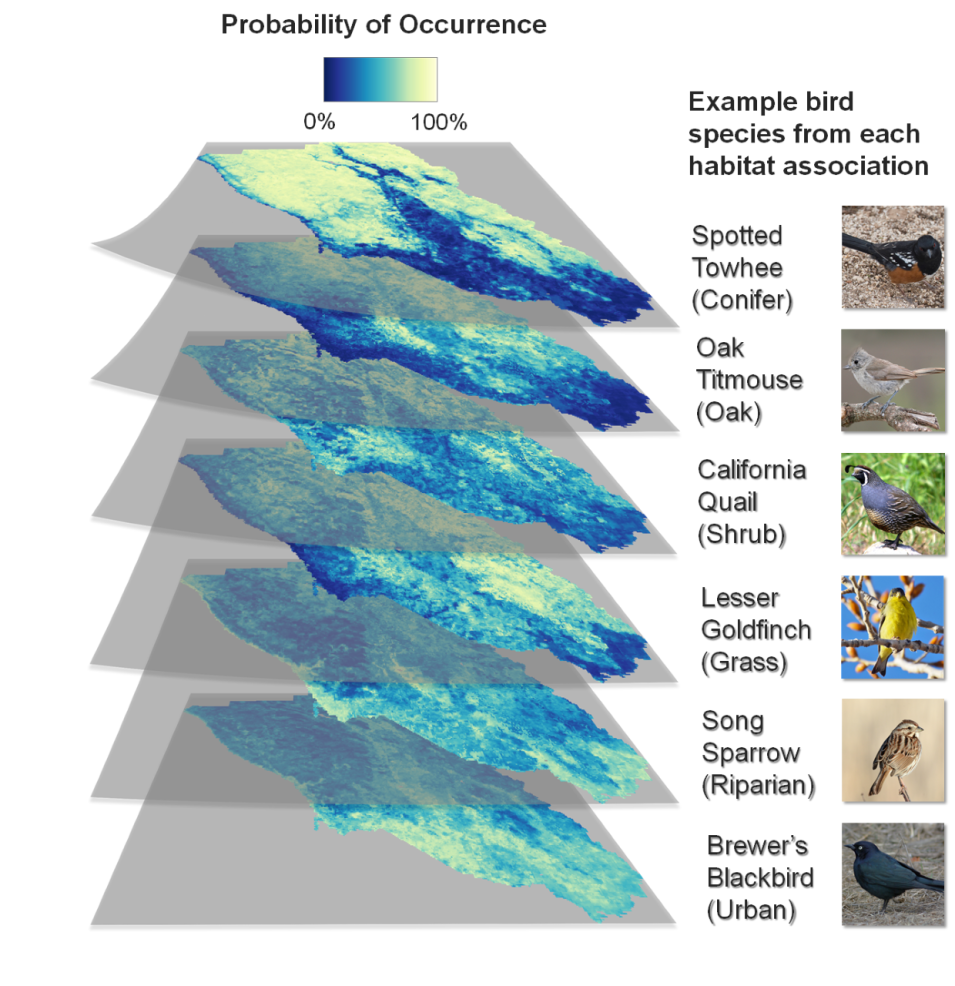
A study by Burns and others (2020) used simulated GEDI data to better understand bird ecology in the U.S. state of California. According to Burns, airborne lidar data have been used to examine relationships between forest canopy structure and faunal diversity but provided researchers with limited spatial coverage. GEDI’s latitudinal coverage will permit these types of analyses at larger spatial extents, over most of the Earth’s forests, and most importantly in areas where canopy structure is complex or poorly understood. Burns’ team examined the impact that GEDI-derived canopy structure variables, such as PAVD, have on the performance of bird species distribution models (SDMs).
The study simulated GEDI waveforms for a two-year period. In addition to these variables, the authors also included phenology, climate, and other auxiliary variables to predict the probability of the occurrence of 25 common bird species in Sonoma County, California. Seven individual machine learning models were then used to make distribution predictions for each species. The canopy structure variables were, on average at the finest resolution of 250 meters (m), the second most important group of predictor variables after the climate variables.
