Data User Profile: Dr. Kyla Drushka

Salinity data from NASA’s PO.DAAC helps Dr. Kyla Drushka investigate sea surface salinity and the circulation and structure of the ocean.

Dr. Kyla Drushka, Principal Oceanographer at the Applied Physics Laboratory, University of Washington

Image
Dr. Kyla Drushka deploys ocean drifters to measure ocean currents at the sea surface. Drushka and her colleagues used these and other devices during a 2018 campaign she co-led off of the California coast near Monterrey/San Francisco. Credit: Peter Gaube.

Research Interests: Understanding the dynamics of the upper ocean and, in particular, the effect that variations in ocean salinity (the concentration of dissolved salts in seawater) may have on and near the ocean surface. In rainy tropical regions and the Arctic, salinity sets the structure and stability of the “mixed layer” – the well-mixed part of the upper ocean that comes into contact with the atmosphere. As a result, changes in salinity caused by precipitation, evaporation, ice melt and freezing, river runoff, or ocean currents can have large impacts on the amount of heat, momentum, and gas exchanged between the ocean and the atmosphere. This, in turn, can have a significant effect on weather and climate.

Research Highlights: Everyone knows seawater is salty, but far fewer know how it got that way and what roles saltiness, or in the vernacular of oceanography, salinity, plays in ocean structure and dynamics. Salinity refers to the concentration of salt in seawater and several natural processes, including the weathering of rocks, the evaporation of ocean water, and the formation of sea ice, contribute to it. At the same time, these salinity-increasing processes are balanced by salinity-decreasing actions, such as the flow of fresh water into the ocean, precipitation in the form of rain or snow, and melting ice.

Scientists have learned that even small variations in ocean surface salinity can have dramatic effects on ocean circulation and structure, particularly near the surface. Ocean circulation is primarily driven by changes in seawater density, and density is determined by salinity and temperature. Given that the top three meters of the ocean stores more heat than the entire atmosphere, density-controlled ocean circulation (that is, when the dense ocean water sinks and joins deep ocean currents) plays a key role in transporting heat around the world and maintaining Earth's climate. Scientists know the ocean absorbs and transports the excess heat associated with the rise in global temperatures that has occurred during the last century. Further, studies suggest that ocean salinity is decreasing at high latitudes and in tropical areas that experience frequent rain, and increasing in the seawater of Earth’s sub-tropical, high-evaporation regions. Such changes in the water cycle could significantly impact not only ocean circulation, but also the climate in which we live. For example, ocean currents act much like a conveyor belt, transporting warm water and precipitation from the equator toward the poles and cold water from the poles back to the tropics. In doing so, ocean currents regulate global climate, helping to counteract the uneven distribution of solar radiation reaching Earth’s surface. Without currents in the ocean, regional temperatures would be more extreme—super hot at the equator and frigid toward the poles—and much less of Earth’s land would be habitable.
Image
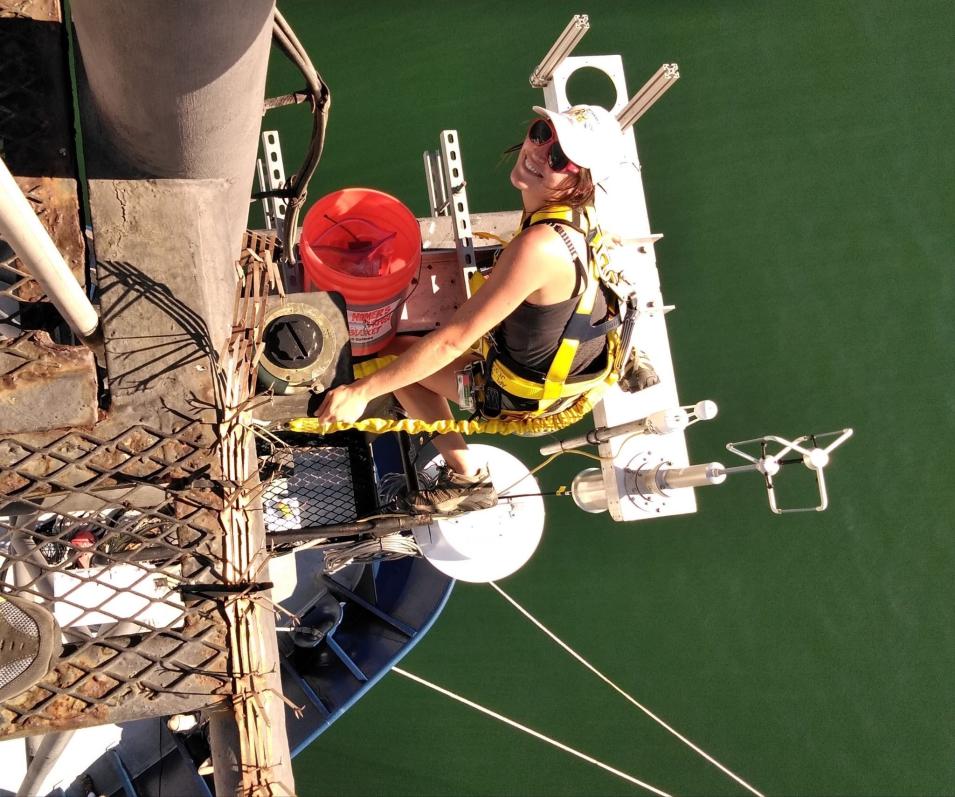
Kyla Drushka installs a disdrometer, an instrument that measures the size of individual raindrops, on mast of the ship R/V Revelle during the SPURS-2 project. " It's important to put this sensor as high as possible on the ship, so that the rain falling on it is not disrupted by the flow around the vessel," she said. Credit: Benjamin Greenwood.

Among the scientists working to understand the impact of variability in ocean salinity is Dr. Kyla Drushka, Principal Oceanographer at the Applied Physics Laboratory, University of Washington.

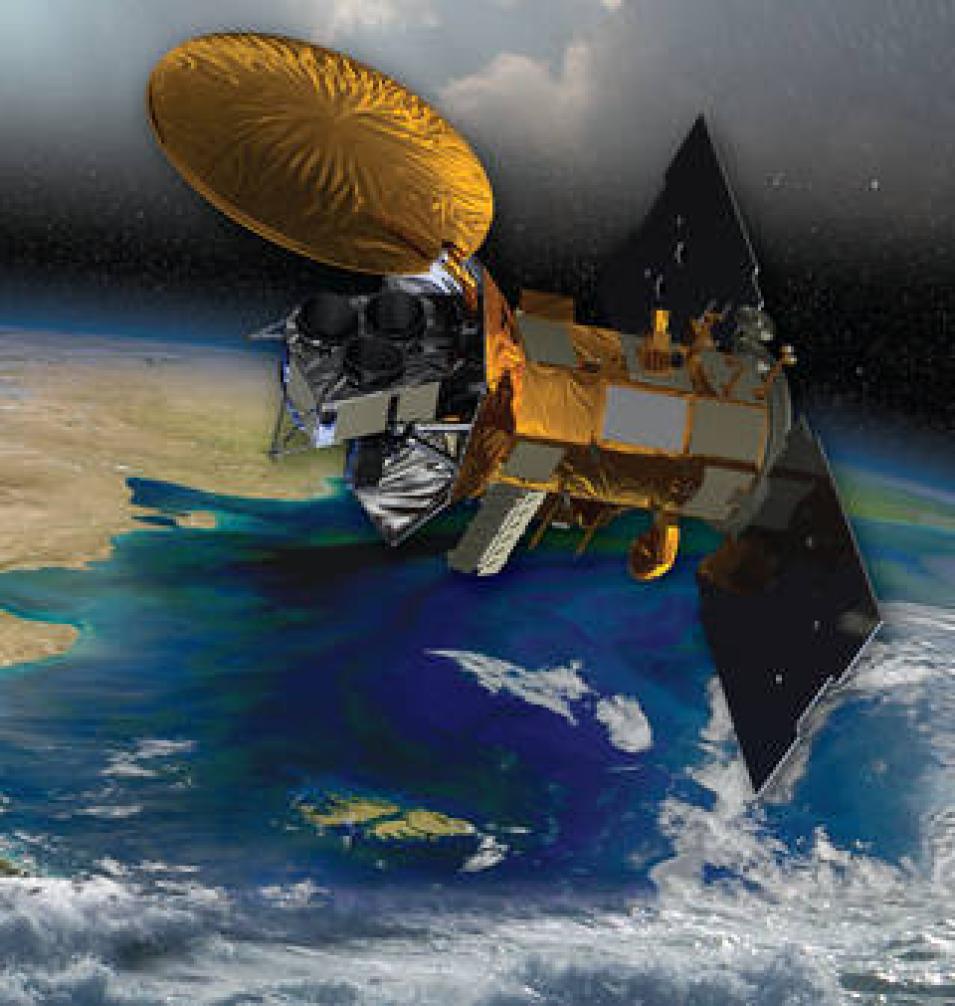
“NASA has been measuring salinity from satellites since 2011, giving us an amazing new tool to monitor ocean variability,” said Drushka. “As a member of NASA’s Ocean Salinity Science Team since 2014, I have been focusing on quantifying and understanding how rainfall affects upper ocean salinity, stability, and air-sea exchanges as well as how we can use this information to improve the validation of salinity measurements such as those from the Aquarius and Soil Moisture Active Passive (SMAP) satellite missions.”

Drushka is currently involved in several projects that aim to enhance the oceanography community’s understanding of the effect of rainfall on salinity in the upper ocean—work that is motivated, in part, by the knowledge that the global hydrological cycle is speeding up due to climate change. Drushka notes, however, that it is hard to measure where and how fast those water cycle changes are happening.

“One idea is that if we knew the relationship between rainfall and ocean salinity, we could use satellite salinity measurements to measure and monitor the water cycle,” she said.

Drushka and her colleagues tested this idea in 2016 and 2017 during the SPURS-2 experiments. The Salinity Processes in the Upper Ocean Regional Study, or SPURS, is a two-part series of science process studies and oceanographic field experiments designed to uncover the mechanisms responsible for near-surface salinity variations in the tropical Pacific Ocean. In particular, SPURS seeks to quantify the relative significance of circulation, evaporation, precipitation over a range of scales in representative areas of the open ocean to explain the ocean’s role in global water cycle budgets and its relationship to climate. Funded principally by NASA with support from other US agencies and European partners, the project involves two field campaigns (SPURS-1 and -2) and a series of cruises in regions of the Atlantic and Pacific Oceans that exhibit salinity and precipitation extremes. The SPURS initiative also incorporates a suite of in-situ sampling technologies that, when combined with satellite-derived measurements of salinity, provide a detailed characterization of the ocean’s salinity structure over a variety of spatiotemporal scales.

Among the technologies that Drushka and her team used during the SPURS-2 experiments was the Surface Salinity Profiler (SSP), which Drushka describes as “a surfboard outfitted with sensors to measure salinity, temperature, and turbulence.” This instrument was towed in the waters of the tropical Pacific Ocean outside of the ship’s wake, allowing it to take surface salinity measurements in water that hadn’t been disturbed by the ship.

Image
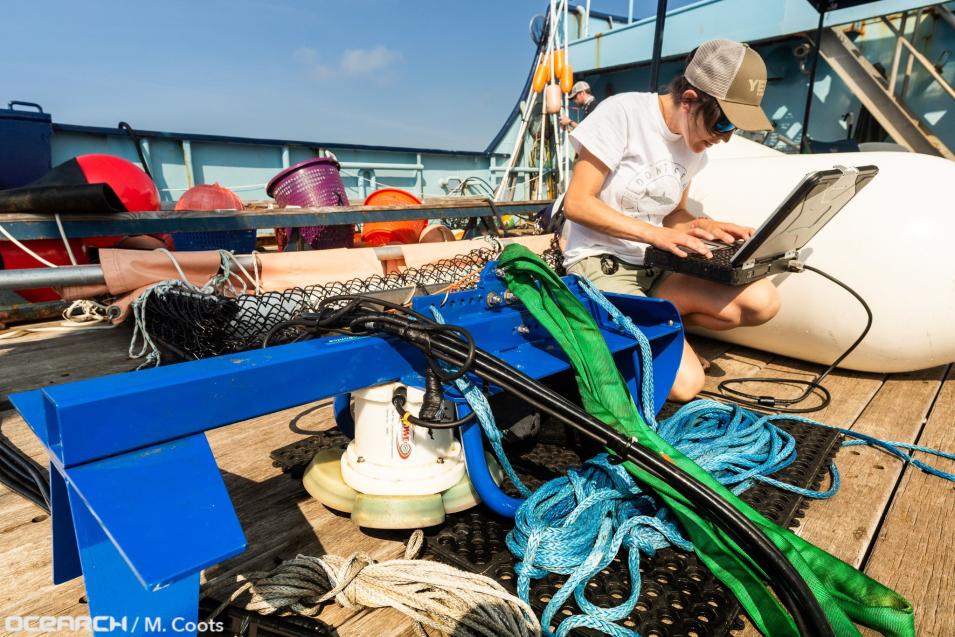
Kyla Drushka connects with the Acoustic Doppler Current Profiler (ADCP) before deploying it over the side of the research vessel OCEARCH. The ADCP, the white device connected to the blue tow-body shown in this photo, collects ocean current (velocity) data as it is towed from the side of the ship. Credit: Mike Coots, OCEARCH.

“The [SSP] data analyzed by University of Washington graduate student Suneil Iyer showed the horizontal and vertical patterns of salinity near the surface, enabling us to develop relationships between salinity, turbulence, rain, and wind,” she said. “I’m currently involved in follow-on projects with my colleagues March Jacob, Elizabeth Thompson, and Haonan Chen to develop simple ways to predict salinity anomalies based on satellite measurements of rain and wind and to understand how the spatial patterns of rainfall imprint on the spatial patterns of salinity.

In addition, Drushka is also developing a new project, Salinity and Stratification at the Sea Ice Edge (SASSIE), that will explore some of the same ocean attributes and mechanisms investigated during the SPURS-2 study, but in the Arctic Ocean.

“In 2022, we will take a ship, airplane, and many autonomous and drifting instruments, including a new jet-powered version of the SSP that is piloted remotely instead of towed, to the Beaufort Sea to measure the near-surface fresh salinity anomalies produced by melting sea ice during the summer,” she said. “Much like with rainfall, these fresh layers on the surface increase the stability and reduce the mixing in the upper ocean. Because the water ~10 meters deep is relatively warm in the Arctic, a reduction in mixing means that this heat stays trapped at this depth and so the ocean surface can cool down faster when the weather gets cold. We hypothesize that regions with fresh, stable melt-water layers at the end of summer will see rapid ice formation in early autumn due to this increased stability and reduction in mixing.”

To conduct their research, Drushka and her colleagues rely on datasets from a variety of sources, including NASA's Physical Oceanography Distributed Active Archive Center (PO.DAAC) located at NASA's Jet Propulsion Laboratory in Pasadena, California. PO.DAAC manages, archives, and distributes the data, tools, and resources in NASA’s Earth Observing System Data and Information System (EOSDIS) collection pertaining to the physical processes and condition of the global ocean, such as ocean winds, sea surface temperature, ocean surface topography, sea surface salinity, and circulation.

Image

Among the PO.DAAC datasets that Drushka and her colleagues use in their research are sea surface salinity and wind speed data from the joint U.S./Argentinian Aquarius/Satélite de Aplicaciones Científicas (SAC)-D (or Aquarius/SAC-D) mission; mapped sea surface salinity data from NASA’s SMAP satellite mission; 5-day mean ocean surface wind data from the Cross-Calibrated Multi-Platform (CCMP) project; and salinity, temperature, turbulence, and water column profile observations derived from the SSP and other instruments used during the SPURS-2 campaign.

For example, in a 2016 study conducted to improve understanding of the formation and evolution of rain-formed lenses (aka: layers of buoyant fresh water) at the ocean surface, Drushka and her colleagues compared sea surface salinity measurements from the Aquarius/SAC-D mission and other platforms with outputs from the Generalized Ocean Turbulence Model (GOTM), a 1-dimensional ocean model used to simulate the impacts of individual rain events on the upper ocean salinity. Prior to this work, it was well known that rain generated fresh lenses at the surface, but neither their characteristics, such as thickness, stratification strength, and longevity, nor their impact on satellite salinity observations had been investigated. After performing several experiments with the GOTM model to explore how meteorological events with different rain rates and wind speeds affect the depth, strength, and duration of rain layers, Drushka and her team found that the GOTM could reproduce the main characteristics of rain-formed fresh lenses. Their research also demonstrated how the presence of rain-formed lenses may account for the “fresh bias,” of satellites wherein satellite-derived measurements of salinity tend to be slightly less saline than in situ measurements in rainy, low-wind regions.

Drushka and her colleagues built on these findings in a 2019 study on the relationship among rain, wind, and salinity. During the SPURS-2 field experiments in the eastern tropical Pacific Ocean in 2016 and 2017, she and her team members used the SSP to measure temperature and salinity profiles in the upper 1.1 m of the ocean. Data from the SSP captured the ocean surface’s response to 35 rain events, providing insight into the generation and evolution of rain-formed fresh layers. For the 35 rain events sampled, the maximum vertical salinity gradient in the upper meter of the ocean ranged from less than 0.01 to over 3 grams per kilogram, which was found to be well correlated with the amount of accumulated rainfall, linearly proportional to the maximum rain rate, and inversely proportional to wind speed. These findings suggest that the vertical salinity gradient formed during any rain event depends on a complex interaction between local ocean dynamics and the highly variable forcing from rain and wind.

“While the modeling results were pretty straightforward, the in-situ measurements [from the SSP] underscore how complex the upper ocean response to rainfall is,” Drushka said. “Nonetheless, the results from this work are an important step in helping predict salinity anomalies from space-based measurements.”

Image
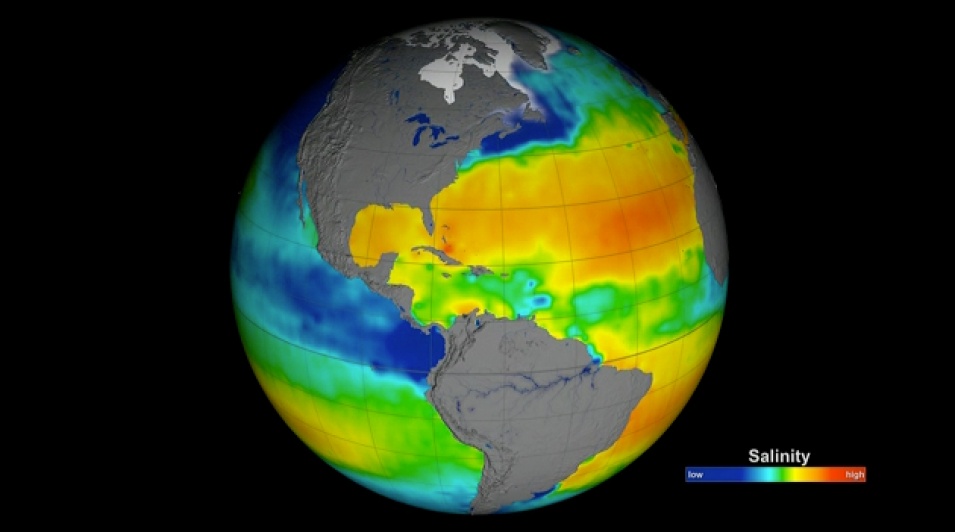
This data visualization shows the first full year of validated ocean surface salinity from NASA's Aquarius instrument, averaged from December 2011 through December 2012. Red colors represent areas of high salinity, while blue shades represent areas of low salinity. Aquarius has provided a global view of salinity variability needed for climate studies. Credit: NASA/GSFC/JPL-Caltech.

In another 2019 paper, Drushka conducted a detailed study of the patterns of sub-mesoscale (i.e., at a scale of 1 to 10 kilometers) temperature and salinity fronts by combining a number of existing databases, which include data from hundreds of ships, to get nearly global coverage of surface salinity and temperature measurements. In doing so, she revealed spatial patterns of surface salinity variability that were previously unknown. Her findings helped to explain why the surface salinity measurements from satellites may differ from those of Argo floats (i.e., satellite errors in highly variable regions in fact arise because Argo measurements made at single location do not represent spatially averaged satellite data.)

“In regions with river plumes, ice melt, and strong currents like the Gulf Stream, surface salinity variability is strong and can have a much larger impact on density and ocean dynamics than temperature does,” she said. “This work also helped show where salinity variability that is smaller than the pixel of a satellite measurement may contribute to satellite errors.”

Small-scale ocean variability is important, as emerging evidence suggests that oceanic structures at scales smaller than 100 km have an important contribution to ocean circulation, air-sea interactions, and biogeochemical cycling. However, satellites that measure sea surface salinity are known to have a resolution lower than 40 kilometers and do not allow the observation of small-scale structures. In the interest of developing techniques for obtaining satellite salinity measurements at the highest possible spatial resolution, Bárbara Barceló-Llull, a postdoctoral researcher working with Drushka, conducted a study to investigate small-scale variability (≲25 km) by reconstructing gridded sea surface salinity observations from the SMAP satellite in the northwest Atlantic Ocean. When compared to in-situ salinity observations made by a ship-board thermosalinograph (i.e., a device used to measure sea surface temperature and salinity), reconstructed SMAP observations revealed a significant improvement in small-scale salinity variability as compared to the original SMAP measurements, particularly from the continental shelf to the Gulf Stream. In the Sargasso Sea, however, both the original and reconstructed SMAP observations contained higher variability than the in-situ observations.

Observational differences aside, small-scale salinity variability was found to be concentrated in two bands: a northern band aligned with the continental shelf break, and a southern band aligned with the Gulf Stream mean position. In addition, seasonal differences in the small-scale salinity variability were mainly driven by the seasonal cycle of the large-scale sea surface salinity induced by the freshening of the coastal waters from river outflow.

These results pertaining to small-scale salinity variability, in conjunction with those of Drushka’s other research, reveal the value of NASA satellite-derived sea surface salinity observations for her research. They also explain why Drushka is so focused on using her growing knowledge of rainfall’s affects upper ocean salinity and stability to enhance the accuracy of satellite salinity measurements, making them even better.

Representative Data Products Used or Created:

Available through PO.DAAC

  • Aquarius CAP Level 3 Sea Surface Salinity Rain Corrected Standard Mapped Image Monthly Data V5.0 (doi:10.5067/AQR50-3QMCS)
  • Cross-Calibrated Multi-Platform Ocean Surface Wind Vector L3.5A Pentad First-Look Analyses (doi:10.5067/CCF35-01AD5)
  • SMAP Level 2B CAP Sea Surface Salinity V5.0 Validated Dataset (doi:10.5067/SMP50-2TOCS)
  • SPURS-2 shipboard Acoustic Doppler Current Profiler data for E. Tropical Pacific R/V Revelle cruises (doi:10.5067/SPUR2-ADCP0)
  • SPURS-2 Towed surface salinity profile (SSP) data for the E. Tropical Pacific R/V Revelle cruises (doi:10.5067/SPUR2-SSP00)

Other data products used:

Read about the Research:

Iyer, S. & Drushka, K. (2021). Turbulence within Rain-Formed Fresh Lenses during the SPURS-2 Experiment, Journal of Physical Oceanography, 51(5), 1705-1721. doi:10.1175/JPO-D-20-0303.1

Barceló-Llull, B., Drushka, K., & Gaube, P. (2021). Lagrangian reconstruction to extract small-scale salinity variability from SMAP observations. Journal of Geophysical Research: Oceans, 126, e2020JC016477. doi:10.1029/2020JC016477

Drushka, K., Asher, W.E., Jessup, A.T., Thompson, E.J., Iyer, S., & Clark, D. 2019. Capturing fresh layers with the surface salinity profiler. Oceanography 32(2):76-85. doi:10.5670/oceanog.2019.215

Drushka, K., Asher, W.E., Sprintall, J., Gille, S.T., & Hoang, C. (2019). Global Patterns of Submesoscale Surface Salinity Variability. Journal of Physical Oceanography, 49(7), 1669-1685. doi:10.1175/JPO-D-19-0018.1

Drushka, K., Asher, W.E., Ward, B., & Walesby, K. (2016). Understanding the formation and evolution of rain-formed fresh lenses at the ocean surface. Journal of Geophysical Research: Oceans, 121, 2673-2689. doi:10.1002/2015JC011527

Explore more Data User Profiles

Last Updated