User Profile: David Mocko

Who uses NASA Earth science data? David Mocko, for using land-surface models to study drought.
David Mocko

David Mocko, Senior Research Scientist (Science Applications International Corporation [SAIC]) supporting the Hydrological Sciences Laboratory at NASA’s Goddard Space Flight Center, Greenbelt, MD

Research interests: Using and evaluating land-surface models to study soil moisture, snow depth/cover, surface fluxes, and drought.

Research highlights: For Washington, D.C., the end of June and the first half of July this past summer were bone dry, with only a trace of rain recorded at Ronald Reagan National Airport. Slightly more rain was recorded north of Washington and at Dulles Airport to the west, but not much more. An article published in the Washington Post on July 13 raised the specter of a regional “flash drought.”

“Flash drought” refers to a drought that develops much more rapidly than a typical drought. They typically exhibit sudden and relatively short periods of warm surface temperatures coupled with anomalously low and rapidly decreasing soil moisture. Precipitation certainly factors in, since a lack of available moisture exacerbates decreases in soil moisture. Clearly, the Washington region was experiencing a lack of precipitation, but was this really a flash drought?

David Mocko and his colleagues at NASA’s Goddard Space Flight Center in Greenbelt, Maryland, were skeptical. They decided to take a closer look using land-surface models driven by meteorological observations. The truth, it turned out, was in the models.

Data about current water availability and soil moisture are acquired in a variety of ways and from many sources, including precipitation records from ground stations and in situ water monitors and gauges (such as calibrated airport rain gauges). Remotely-sensed data from Earth observing satellites also play an important role in providing these data, such as precipitation data from the joint NASA/Japan Aerospace Exploration Agency Global Precipitation Measurement (GPM) Core Observatory (launched in 2014) and soil moisture data from NASA’s Soil Moisture Active Passive (SMAP) satellite (launched in 2015).

Along with providing information about ongoing events, these data (supplemented with historic records) serve as input to mathematical land-surface models that are used to produce representations of current environmental conditions (such as U.S. Drought Monitor maps) and forecast potential environmental conditions (such as seasonal climate predictions produced by the National Weather Service’s Climate Prediction Center). These datasets also are used to verify land-surface models, or LSMs, to help ensure that the model simulations accurately represent real-world conditions.

As a Senior Research Scientist in the Hydrological Sciences Laboratory, David Mocko programs and uses software behind LSMs to run computer simulations for testing new LSMs and for exploring soil moisture, snow depth/cover, surface fluxes, and drought (both current and historic). He also is one of the core contributors to NASA’s Land Information System (LIS) software framework, specifically as a member of the LSM team that incorporates different surface models into the LIS.
 

LIS logo

LIS is a software suite comprising three modeling components: (1) the Land surface Data Toolkit (LDT), which handles the data-related requirements of LIS, (2) LIS, which is the actual modeling system that includes land-surface models, data assimilation algorithms, optimization and uncertainty estimation algorithms, and high performance computing support, and (3) the Land surface Verification Toolkit (LVT), which is a model verification and benchmarking environment that enables rapid prototyping and evaluation of model simulations by allowing users to compare model output against a comprehensive collection of in situ, remote sensing, and model and reanalysis data products. NASA’s Dr. Sujay V. Kumar is the overall technical lead for LIS development.

Processing the enormous amount of data required for modeling the natural world is a task far beyond what any desktop computer can handle. Mocko’s computing platform of choice is the “Discover” supercomputer located at NASA’s Goddard Space Flight Center. To be more precise, Discover is not just a computer, it is a “90,000-core supercomputing cluster of multiple Linux scalable units built upon commodity components capable of nearly 3.5 petaflops, or 3,500 trillion floating-point operations per second [FLOPS],” to use the language of the NASA Center for Climate Simulation (NCCS). In other words, Discover uses a huge number of individual computers working in parallel to create fine-scale simulations of the atmosphere and oceans for short-term (months to years) climate predictions and long-range (decades to centuries) climate change projections. After programming and running job scripts on Discover, Mocko uses the simulation results for his scientific studies.

Mocko also is a co-Principal Investigator (PI) (along with lead PI Dr. Christa Peters-Lidard of NASA) for research on and development of the North American Land Data Assimilation System (NLDAS). NLDAS is a collaborative effort jointly led by the National Oceanic and Atmospheric Administration (NOAA) National Centers for Environmental Prediction’s (NCEP) Environmental Modeling Center (EMC) and by NASA’s Goddard Space Flight Center. NLDAS uses the best available observations and model output to construct quality-controlled, spatially and temporally consistent LSM datasets to support modeling activities. This, in turn, helps reduce errors in the calculations of soil moisture and energy that often occur in numerical weather prediction models and helps improve the accuracy of these forecast models.


NLDAS logo

NLDAS datasets are used in a wide range of applications, including drought monitoring, land initialization for atmospheric weather and climate forecast models, streamflow and water quality studies, water and energy cycle studies, mosquito monitoring, and soil moisture studies. These datasets are available through the Goddard Earth Sciences Data and Information Services Center (GES DISC), which is the Earth Observing System Data and Information System (EOSDIS) Distributed Active Archive Center (DAAC) responsible for NASA Earth science data related to global precipitation, atmospheric composition, atmospheric dynamics, hydrology, and solar irradiance.

Mocko and his colleagues currently are working on adding the Noah-Multiparameterization (Noah-MP) LSM into NLDAS. Noah-MP includes an option to run a dynamic vegetation scheme that simulates vegetation based on evolving conditions. This is an important parameter in drought and soil moisture calculations since vegetation (both in extent and growth stage) can affect variables including soil moisture, transpiration, and water storage.

The team found, though, that the dynamic vegetation option in Noah-MP had difficulty simulating drought in the U.S. Central Plains, especially in regard to accurately representing soil moisture and transpiration. By incorporating leaf area index (LAI) data produced from Moderate Resolution Imaging Spectroradiometer (MODIS) data, the team found that Noah-MP does a better job depicting drought, particularly in agricultural areas. Other recent studies done by the LIS and NLDAS teams show that assimilating soil moisture data (such as from SMAP), snow cover data (such as from MODIS), and terrestrial water storage data from the joint NASA/German Aerospace Center Gravity Recovery and Climate Experiment (GRACE)—

operational 2002 to 2017—also improves simulations of soil moisture, streamflow, and drought. These enhancements will be part of the next phase of NLDAS.

Which brings us back to the work by Mocko and his colleagues using LSMs as part of their examination of “flash drought” conditions in the Washington region this past summer. In a LIS blog post, the team observes that key flash drought criteria were not met in the region, specifically longevity of the drought (a mid-latitude location like Washington that doesn’t have a very distinct rainy season requires a minimum drought length of at least four weeks to reach flash drought status) and the uniqueness of these conditions in space and time (it’s not unique for the region to be hot and dry for periods of time in the middle of summer).


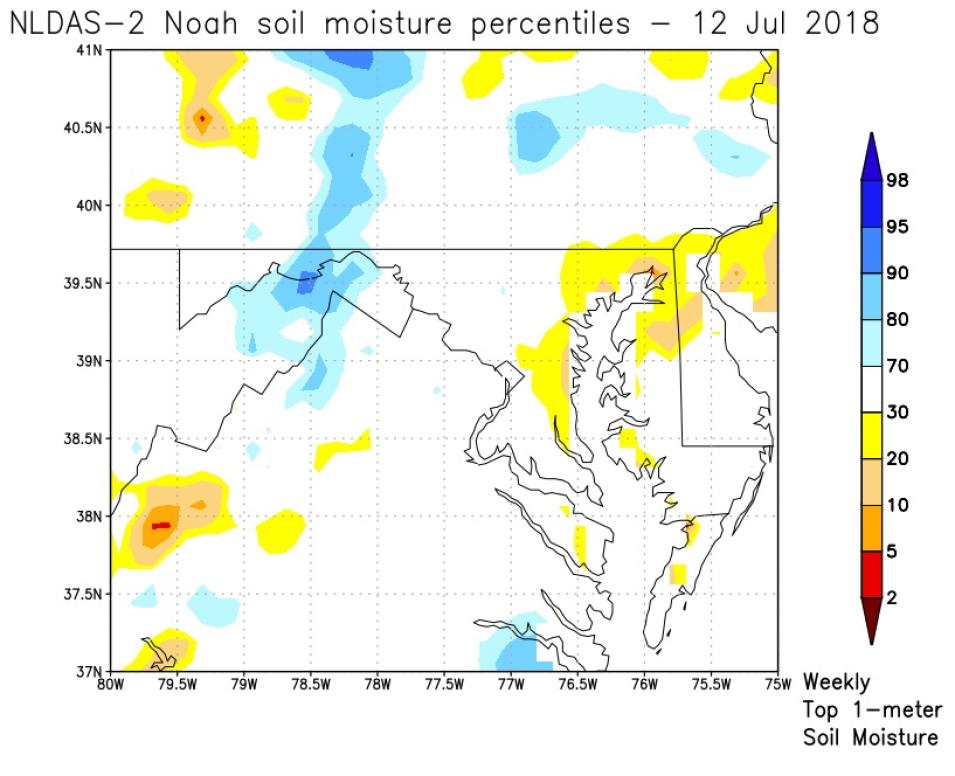
Image
Soil moisture percentiles for the Washington region from the NLDAS Phase 2 Noah LSM for the top 1-meter of soil as of July 12, 2018. Colors indicate drought categories defined by the U.S. Drought Monitor, from abnormally dry (yellow) to exceptional drought (dark red). Abnormally moist areas on the same scale are shown in blue shades. Image and caption text from Hunt, et al., 2018.

LSMs provide even more evidence to refute the flash drought claim. Using NLDAS soil moisture products, the team observed that root zone soil moisture (from the surface to 1-meter deep) as of July 12 was generally still in the ‘normal to moist’ range for this time of year, and only a few areas east of Washington showed, at most, “abnormally dry” conditions. These data were supported by the July 10 U.S. Drought Monitor, which does not indicate even abnormally dry conditions south of New York state (abnormally dry conditions do appear over the region in the U.S. Drought Monitor map for July 17, but this is still above the threshold required for “drought” designation). In fact, NLDAS-2 Noah LSM top 1-meter soil moisture data indicated that only about 20 percent of the region was “abnormally dry” by July 12. Based on their combination of model and observed data, the team noted that while dry conditions may have been developing in the Washington region in late-June and early-July, a two-week period without rain was not enough, by itself, to warrant the designation of “flash drought.”

Four days after the Washington Post “flash drought” article, storms dropped more than 2.7 inches of rain at National Airport followed by four inches of rain on July 21. Despite the mid-summer dry period, the region never reached drought conditions before the torrential rain of mid-July. In fact, 2018 just became the wettest year ever recorded in Washington, D.C., according to the National Weather Service. For David Mocko and his colleagues, the truth was in the models.

Representative data products used:

Read about the research:

Hunt, E., Santanello, J., Otkin, J., Mocko, D.M., Kumar, S.V. & Lawston, P. (2018) “Was Washington DC really in a flash drought?” NASA LIS blog post published Thursday, July 19, 2018. Available online at https://lis.gsfc.nasa.gov/blog/was-washington-dc-really-flash-drought.

Kumar, S.V., Jasinski, M.F., Mocko, D.M., Rodell, M., Borak, J.S., Li, B., Beaudoing, H.K. & Peters-Lidard, C.D. (2018). “NCA-LDAS land analysis: Development and performance of a multisensor, multivariate land data assimilation system for the National Climate Assessment.” Journal of Hydrometeorology, (accepted). Published online March 9, 2018 [doi:10.1175/JHM-D-17-0125.1].

Mocko, D.M., Peters-Lidard, C.D., Wang, S., Kumar, S.V. & Xia, Y. (2018). “Drought Depiction in the Noah-MP (Multiphysics) Land Surface Model in the North American Land Data Assimilation System (NLDAS).” Presentation at the American Meteorological Society 98th Annual Meeting, Austin, TX, January 8, 2018. Link to recorded presentation.

Kumar, S.V., Wang, S., Mocko, D.M., Peters-Lidard, C.D. & Xia, Y. (2017). “Similarity Assessment of Land Surface Model Outputs in the North American Land Data Assimilation System (NLDAS).” Water Resources Research, 53(11): 8941-8965 [doi:10.1002/2017wr020635].

Xia, Y., Mocko, D.M., Huang, M., Li, B., Rodell, M., Mitchell, K.E., Cai, X. & Ek, M.B. (2017). “Comparison and assessment of three advanced land surface models in simulating terrestrial water storage components over the United States.” Journal of Hydrometeorology, 18(3): 625-649 [doi:10.1175/jhm-d-16-0112.1].

For more information


Explore more Data User Profiles.

Last Updated