User Profile: Dr. Nadia Smith

Data from NASA’s GES DISC helps scientists like Dr. Nadia Smith build and improve retrieval systems that provide important information to climate scientists and meteorologists around the globe.

Dr. Nadia Smith, Research Scientist, Science and Technology Corporation and affiliate at NASA’s Jet Propulsion Laboratory (JPL) in Pasadena, California

Image
Nadia Smith stands on the rooftop of the Space Science and Engineering Center (SSEC), at the University of Wisconsin-Madison. SSEC is a “direct broadcast” site, which allows it to downlink measurements directly from the instruments as the satellite comes into view of the antennas. Smith worked at the SSEC for eight years as a researcher before she joined STC and contributed retrieval algorithms to the Community Satellite Processing Package.

Research Interests: Satellite remote sounding with space-based hyperspectral infrared instruments that measure the radiance emitted by Earth’s surface and atmosphere in very narrow spectral intervals to quantify conditions at multiple pressure layers throughout the atmospheric column; building, improving, and innovating data retrieval systems; designing high-quality data products that address specific science questions and operational needs.

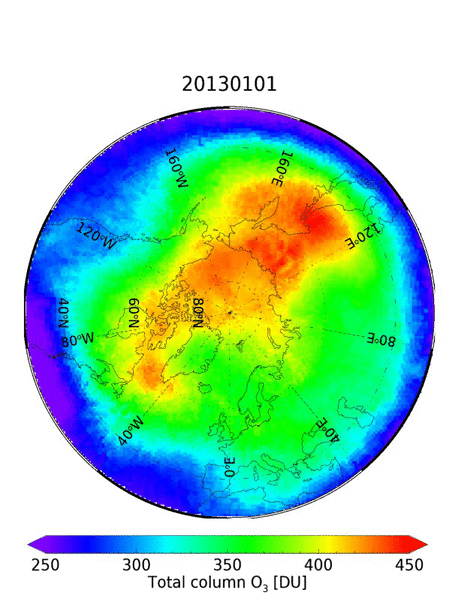
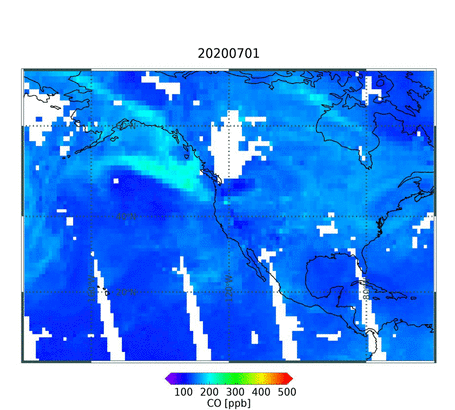
Research Highlights: In the context of Earth-observing satellites, the term sounding may seem something of a misnomer. Rather than referring to the detection or emission of sound, the word comes from the nautical term "to sound," which means “to take measurements.” Taking measurements is precisely what atmospheric sounding instruments, such as the Atmospheric Infrared Sounder (AIRS) aboard NASA’s Aqua satellite and the Cross-track Infrared Sounder (CrIS) aboard the NOAA-20 (formerly JPSS-1) and joint NASA/NOAA Suomi National Polar-orbiting Partnership (Suomi NPP) satellites do: they observe the energy emitted by molecules in the atmosphere to measure a variety of characteristics, including temperature, water vapor, and trace gas concentrations, at various heights within the vertical column of Earth’s atmosphere.

Atmospheric sounders on spacecraft are critical to the study of weather and climate because they can “see” the atmosphere’s vertical structure and composition in ways that are invisible to the human eye and at spatial scales that are beyond the reach of instruments on weather balloons or aircraft. The infrared part of the electromagnetic spectrum allows the detection of cloud optical properties, as well as the molecular vibrations and rotations from various trace gas species, namely water vapor (H2O), ozone (O3), carbon monoxide (CO), carbon dioxide (CO2), methane (CH4), nitrous oxide (N2O), nitric acid (HNO3) and sulphur dioxide (SO2).

Although infrared sounders cannot see through thick clouds, microwave sounders can (because microwave radiation is insensitive to all types of clouds, except those filled with water droplets). When you pair the measurements from both infrared and microwave instruments in a retrieval system, you can retrieve the thermodynamic and chemical state of the atmosphere in varying degrees from the surface all the way through the troposphere and stratosphere to the top of atmosphere.

Among the scientists benefiting from and using satellite sounding data is Nadia Smith, a Research Scientist with Science and Technology Corporation and an affiliate at JPL. Smith’s work involves the design and development of retrieval systems that use the Level 1B products of infrared and microwave satellite measurements to retrieve atmospheric state variables, such as air temperature, tropospheric water vapor, cloud top pressure, that meteorologists and Earth scientists can readily apply in their analyses.

Image
CLIMCAPS retrieves atmospheric variables from AIRS and AMSU Level 1B radiance measurements. This figure depicts the AIRS Level 1B radiance measurements (GES DISC DOI: 10.5067/YZEXEVN4JGGJ) converted to brightness temperature that is used as input to CLIMCAPS. Note the large range of temperature over cloud tops as well as land and ocean surfaces in and around Hurricane Michael as it approaches northwestern Florida around 3:00 AM local time on Tuesday, October 10, 2018. Credit: NASA.

In addition to her position with Science and Technology Corporation, Smith also volunteers scientific services. She has been a member of the User Working Group (UWG) of NASA’s Goddard Earth Sciences Data and Information Services Center (GES DISC) since 2018 and was recently elected to chair UWG for the next three years.

GES DISC is one of 12 NASA Distributed Active Archive Centers (or DAACs). Located within NASA's Goddard Space Flight Center in Greenbelt, Maryland, GES DISC manages, archives, and distributes the data, tools, and resources in NASA’s Earth Observing System Data and Information System (EOSDIS) collection pertaining to a wide range of global climate data, concentrated primarily in the areas of atmospheric composition, atmospheric dynamics, global precipitation, and solar irradiance.

The UWG helps identify and coordinate scientific data needs from a range of sectors and contributes to the evolution and development of data management services at the GES DISC. In another role, Smith co-chairs, with Prof. Peter Thorne, the Global Climate Observing System’s (GCOS) Atmospheric Observation Panel for Climate (AOPC), which coordinates and provides scientific and technical guidance on atmospheric observations for climate research and monitoring. The latest version of the GCOS status report was published earlier this year and the GCOS Implementation Plan is due in 2022. In addition, Smith was recently appointed an Honorary Fellow at the Space Science and Engineering Center (SSEC) at the University of Wisconsin-Madison and will serve in this capacity until Spring 2022.

“On a day-to-day basis, my work focuses on building, improving, and maintaining retrieval systems that run operationally at national centers, such as (GES DISC), as well as direct broadcast sites,” says Smith. “It takes strong teamwork and dedication to implement retrieval systems that maintain a continuous stream of information, from space-based measurements to observations useful to climate scientists and meteorologists in a wide range of sectors.”

One such retrieval system is the Community Long-term Infrared Microwave Combined Atmospheric Product System (CLIMCAPS), for which Smith is now the Principal Investigator and Dr. Chris Barnet the Co-Investigator. Barnet and Smith developed CLIMCAPS Version 2 with a grant awarded by NASA's Research Opportunities in Space and Earth Sciences (ROSES) program in 2017. Winning a follow-on ROSES grant in 2021, Smith and Barnet will focus the next three years on refining and improving the multi-decadal, multi-instrument CLIMCAPS record as one of the baseline NASA records about the atmospheric state that will be available to the global scientific community through the GES DISC and its state-of-the-art cloud data services.

The CLIMCAPS algorithm retrieves profiles of temperature, water vapor and trace gases (CO2, CO, O3, N2O, HNO3 and CH4) along with cloud and Earth surface properties from infrared and microwave instruments on three polar-orbiting satellites: AIRS and the Advanced Microwave Sounding Unit (AMSU) aboard Aqua and CrIS and the Advanced Technology Microwave Sounder (ATMS) aboard on Suomi NPP and NOAA-20. CrIS will be launched on three additional Joint Polar Satellite System (JPSS) satellites over the next decade to continue the record AIRS started well into the 2040s. Measurements from these instruments collectively span nearly two decades of daily observations (2002 to present) and the retrieved CLIMCAPS Level 2 product can thus have value in a range of applications that characterize and monitor diurnal and seasonal atmospheric processes across different times and regions of the globe.

Image
Image
Image
CLIMCAPS total column O3 [values in Dobson Units] represented as gridded monthly averages over the Arctic (left) and Antarctic (right). This time-series is made up of CLIMCAPS retrievals from all three platforms CLIMCAPS-Aqua (AIRS and AMSU) 2013 to 2015, CLIMCAPS-Suomi NPP (CrIS and ATMS) for 2016 to 2017, and CLIMCAPS-NOAA-20 (CrIS and ATMS) for 2018 to 2020. These animations show the seasonal patterns of ozone loss in the polar regions and contrast the northern and southern hemispheres that are subject to different thermodynamic and chemical regimes. When analyzed alongside other co-located CLIMCAPS variables, such as tropospheric and stratospheric temperature, one can characterize the processes driving these cycles.

As demonstrated in these animations of CLIMCAPS retrievals, long-term records of atmospheric observations that cover the globe over land and ocean can offer critically important insight into Earth system processes and help quantify and characterize change over time. However, generating a long-term record of observations that are made up of measurements from different instruments and space-based platforms is difficult.

“Satellites have a limited lifetime in space (~5 to 20 years) and the launch of each replacement instrument introduces new technology that can disrupt data continuity. CLIMCAPS retrieves soundings from both AIRS (Aqua) and CrIS,” she said. “At first order this means developing the capability to ingest and process measurements from different instruments using the same retrieval method. But to assemble a record of soundings that accurately quantifies Earth system change requires an in-depth understanding and deliberate mitigation of all known sources of systematic uncertainty, which includes instrument noise.”

Aside from these uncertainties, which Smith and her colleague Christopher D. Brant discuss in a 2020 paper about CLIMCAPS published in the journal Atmospheric Measurement Techniques, another question is whether the retrieved variables accurately quantify atmospheric conditions at multiple spatial and temporal scales.

“The answer may appear straightforward enough because all you need is to compare your record of observations against an independent dataset that measures true atmospheric change at regional and global scales across daily, seasonal, and annual increments,” said Smith. “But the challenge in finding such a long-term dataset of ‘true’ global observations can stun even the most enthusiastic among us. The simple fact is it doesn’t exist. Instead, we are resolved to doing in-depth analyses and comparisons against an ensemble of other data sources from which we can derive an estimate of accuracy at best.”

CLIMCAPS Level 2 products depend on Level 1B NASA Earth science datasets from AIRS, AMSU, CrIS and ATMS, as well as daily assimilated fields from the Modern-Era Retrospective analysis for Research and Applications, Version 2 dataset (MERRA-2). Further, to evaluate the accuracy of CLIMCAPS products and develop science applications, Smith said that she and her colleagues “depend on a whole suite of Earth science data products, including forecast models, assimilated data, other satellite observations, as well as those from instruments onboard aircraft or at ground sites.”

Image
CLIMCAPS mid-tropospheric CO [ppb] represented as gridded daily averages. This time-series is made up of CLIMCAPS retrievals from CrIS+ATMS on NOAA-20 from 1 July to 31 October 2020. Hyperspectral sounders are sensitive to CO in the mid-troposphere (around 500 hPa) and therefore able to observe and track the long-range transport of this pollutant gas. This animation depicts the daily transport of industrial pollution from East to West together with the transport of CO in occasional smoke plumes from mega-fires in the Western United States. When analyzed with other co-located CLIMCAPS variables, such as water vapor, temperature, cloud fraction and cloud top pressure, one can study how these pollution events change over time and affect local weather.

The release of the full CLIMCAPS Version2 Level 2 data record in the Spring of 2021 was significant, said Smith, because it marked the first time that Level 2 products from the same system became available for Aqua (2002 to present), Suomi NPP (2012 to 2020), and NOAA-20 (2017 to present).

“[This release] gives the scientific community the opportunity to evaluate AIRS and CrIS instrument observing capabilities side-by-side and across multiple years,” she said.

In addition, the full CLIMCAPS v2 Level 2 data record’s release is noteworthy because CLIMCAPS is the first nadir-infrared NASA system to retrieve soundings of stratospheric gas-phase HNO3, which plays a major role in polar ozone chemistry.

“This new retrieval variable gives us the opportunity to study whether coincident observations of stratospheric HNO3, O3, and temperature from AIRS and CrIS can complement satellite-based limb sounder measurements to help monitor Arctic chemical ozone loss under changing climate conditions in the long run,” Smith said.

The CLIMCAPS v2 Level 2 product was designed to output averaging kernel matrices (i.e., measures of how and where retrievals are sensitive to changes in the “true” state) for seven variables — temperature, H2O, O3, CO, CH4, CO2 and HNO3 — at every cloud cleared retrieval scene so that future data assimilation systems can ingest CLIMCAPS soundings, including those pertaining to trace gas species, to improve their modeling capability. According to Smith, these averaging kernels enable diagnostic and investigative research of satellite nadir infrared observing capability and stability across multiple decades, which is beneficial as the uncertainty in each infrared measurement for a target variable varies with atmospheric conditions, such as surface emissivity, temperature, lapse rate, and amount of water vapor, which can affect data comparisons under different seasonal or diurnal conditions and may skew the interpretation of long-term trends.

“One of the primary goals of the CLIMCAPS long-term record of sounding observations is to support the characterization of Earth system change over time, and that means that we must understand and quantify data quality and also rigorously characterize and understand data uncertainty under a range of conditions across space and time,” Smith said.

Prior to her work on the CLIMCAPS system, Smith collaborated with scientists from NASA’s Short-term Prediction Research and Transition Center (SPoRT), the UW-Madison SSEC, and forecasters with NOAA's National Weather Service (NWS) from 2016 to 2019 to develop a new method for visualizing atmospheric soundings in the Advanced Weather Interactive Processing System (or AWIPS), which ingests and displays data products from a wide array of sources to support weather analysis and forecasting.

As noted in a 2020 paper co-authored by Smith, since 2014, sounding products from the NOAA-Unique Combined Atmospheric Processing System (NUCAPS) are operationally available to the NOAA weather forecasting community through AWIPS. The inclusion of NUCAPS in AWIPS gave forecasters the ability to visualize hyperspectral infrared sounding observations as thermodynamic plots of temperature and dewpoint profiles (or “Skew-T” diagrams). This is also how forecasters view radiosondes, so the inclusion of NUCAPS gave forecasters the ability to compare these two data sources in an easy and intuitive way. With thousands of satellite soundings supplementing the sparse radiosonde network, forecasters suddenly had ready access to wide swaths of satellite soundings to help them characterize the pre-convective environment, when radiosonde data are sparse or absent.

Over time, forecasters began applying NUCAPS soundings to different forecasting scenarios, such as the cold air aloft aviation hazard (i.e., cold temperatures at jet-cruising altitudes can cause airliner fuel to gel) which Smith co-authored in a 2019 publication. This and other novel applications inspired the design of Gridded NUCAPS, which allowed forecasters to visualize incoming swaths of NUCAPS soundings as horizontal or vertical cross-sections, instead of one individual sounding at a time. The methodology to ingest and display satellite soundings as a series of gridded values at different pressure levels, instead of one vertical profile at a time, was later refined by Smith and her colleagues through an iterative process involving significant end user assessment and feedback.

Image
Nadia Smith (STC) and Kris White (NASA SPoRT/NOAA NWS) test and evaluate the Gridded NUCAPS product within the NOAA Advanced Weather Interactive Processing System (AWIPS) at the Hazardous Weather Testbed in 2018.

As a result of this process and collaborative efforts within the JPSS Proving Ground and Risk Reduction program’s (PGRR) Sounding Initiative, AWIPS now has the operational ability to display NUCAPS soundings as plan-views and cross-sections of the three-dimensional atmosphere through the Gridded NUCAPS capability. Gridded NUCAPS has operational applications in severe weather forecasting because overpasses from NOAA-20’s and Suomi NPP’s CrIS instruments at approximately 1:30 pm local time inform forecast models ahead of afternoon thunderstorms during summer and allow forecasters to better characterize peak afternoon pre-convective environment.

“Our conversations with forecasters and participation in their forecast decision-making processes helped us better understand their data needs, which led us to develop a product that delivered sounding information more effectively,” said Smith. “This was a valuable lesson in algorithm and product design, and it taught us to never be too far removed from the end-users.”

Given Smith’s desire to meet users’ data needs by refining satellite sounding products, and her awareness of the benefits of long-term data records such as those provided by CLIMCAPS, it’s hard to believe she’s ever too far removed.

“Hyperspectral sounders, such as AIRS and CrIS, were primarily developed and subsequently launched into low-Earth orbit to improve weather forecasts and data assimilation systems with instantaneous observations of atmospheric temperature and moisture. But with nearly two decades of hyperspectral measurements and a record that is set-up to continue well into the 2040s with the JPSS series of satellites, researchers increasingly seek to use these atmospheric sounding retrievals in long-term studies of large-scale Earth system change. We are maintaining and refining CLIMCAPS in direct response to an evolving end-user base to ensure the availability of relevant and meaningful data products that can support climate research and the characterization of atmospheric processes.”

Representative Data Products Used or Created
Available through GES DISC:

Read about the Research:

Smith, N. & Barnet, C.D. (2020). CLIMCAPS observing capability for temperature, moisture, and trace gases from AIRS/AMSU and CrIS/ATMS. Atmospheric Measurement Techniques, 13: 4437­-4459. doi:10.5194/amt-13-4437-2020

Smith, N. & Barnet, C.D. (2019). Uncertainty characterization and propagation in the Community Long-term Infrared Microwave Combined Atmospheric Product System (CLIMCAPS). Remote Sensing, 11: 1227. doi:10.3390/rs11101227

Berndt, E., Smith, N., Burks, J., White, K., Esmaili, R., Kuciauskas, A., Duran, E., Allen, R., LaFontaine, F., & Szkodzinski, J. (2020). Gridded satellite sounding retrievals in operational weather forecasting: product description and emerging applications. Remote Sensing, 12(20): 3311. doi:10.3390/rs12203311

Smith, N., et al. (2018). What Is a Satellite Measurement? Communicating Abstract Satellite Science Concepts to the World. 98th American Meteorological Society Annual Meeting, 7-11 Jan 2018, Austin, TX. 

Smith, N., Esmaili, R., & Barnet, C.D. (2021). Community Long-term Infrared Microwave Combined Atmospheric Product System (CLIMCAPS) Science Applications Guide. Available online from GES DISC.

You can see more of Smith’s research here.


Explore more Data User Profiles

Last Updated