Geographic Information Systems Data Pathfinder

GIS is a collection of computer-based tools for organizing information from a variety of data sources to map and examine changes on Earth. It is designed to capture, store, manage, analyze, and visualize all types of geographical data. This NASA GIS Data Pathfinder links to NASA GIS-ready datasets, geospatial services, and tools for accessing data.
Image
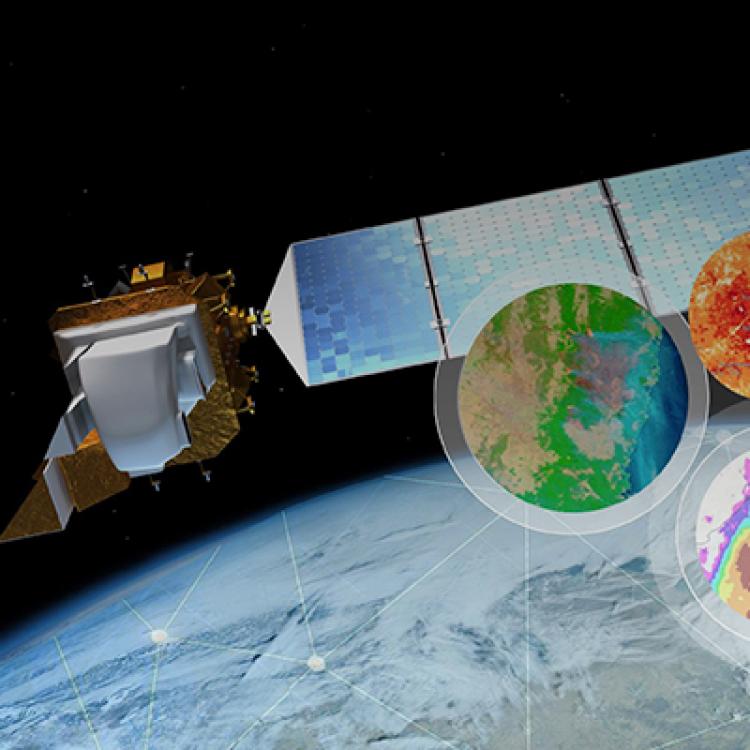
Visual representation of data layers or themes in a GIS. Credit: NASA.

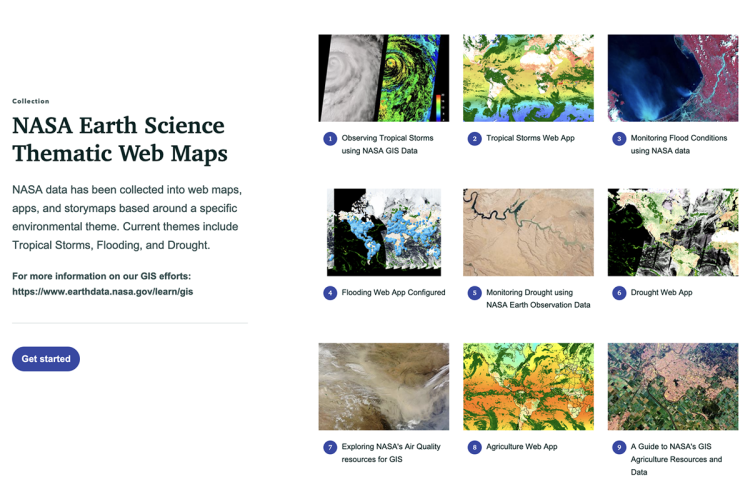
A Geographic Information System (GIS) connects a wide range of geospatial data to a map and integrates location data (where things are) with various types of descriptive information (what things are like there). The vision of NASA's Earth Science Data Systems (ESDS) Program is to identify and deliver high value Earth science data in formats compliant and compatible with GIS standards; to ensure data are interactive, interoperable, accessible, and GIS-enabled through primary GIS platforms; and to provide the maximum impact to research, education, and public user communities requiring data visualization and spatial analysis.

A Geographic Information System (GIS) connects a wide range of geospatial data to a map and integrates location data (where things are) with various types of descriptive information (what things are like there). The vision of NASA's Earth Science Data Systems (ESDS) Program is to identify and deliver high value Earth science data in formats compliant and compatible with GIS standards; to ensure data are interactive, interoperable, accessible, and GIS-enabled through primary GIS platforms; and to provide the maximum impact to research, education, and public user communities requiring data visualization and spatial analysis.

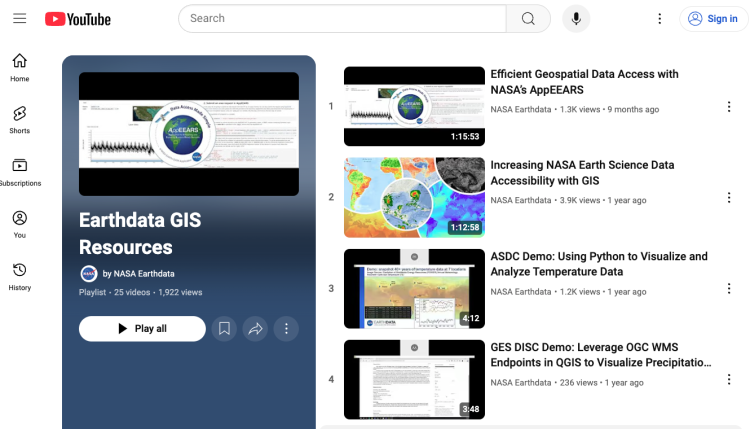
This Data Pathfinder provides links to resources for accessing and using GIS-based Earth science data and assumes a basic understanding of GIS and GIS-based applications. If you are unfamiliar with GIS or want more information about some of the terms and concepts described below, please see the Earthdata GIS Backgrounder. Additionally, the GIS Playlist on the Earthdata YouTube channel provides a variety of GIS presentations and tutorials.


Working with Multidimensional Data in GIS

In recent years, GIS software has increased support for integrating multidimensional scientific data formats in their platforms. Two commonly used GIS software programs are QGIS and ArcGIS Pro. If you do not have these software packages, visit the following links for more information:

In tools such as QGIS and ArcGIS, support for raster data can be provided using a mosaic dataset. A mosaic dataset is a data model that acts as a shell to input a collection of multiple raster files, which include different file types, and is viewed as a single image. A multidimensional mosaic dataset stores information about the dimensions and variables as fields in the mosaic dataset footprint table. The underlying raster data do not have to be connecting or overlapping but can be isolated or intermittent datasets. In some GIS software platforms, a single mosaic dataset can then be used to query, process, analyze, and serve data.

Related Tutorials: /learn/gis/gis-how-tos

NOTE: ArcGIS Pro, on which some Use Cases in this Data Pathfinder are based, is designed to run on a Windows-based operating system. Esri provides an informational page for running ArcGIS Pro on a Mac-based operating system.

Using Synthetic Aperture Radar Data in GIS

Interested in Synthetic Aperture Radar (SAR)? The What is Synthetic Aperture Radar? Backgrounder will help you learn about the benefits and limitations of these powerful data.

Image
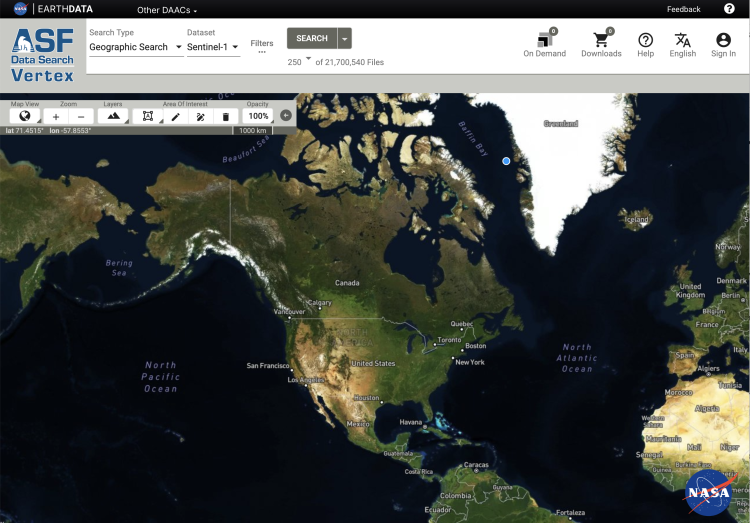
this is an image of the vertex data search tool
Screenshot of the ASF DAAC Vertex data search tool. Credit: NASA's ASF DAAC.

Vertex is a data search tool created by NASA's Alaska Satellite Facility DAAC (ASF DAAC) that provides access to a wide array of archived synthetic aperture radar (SAR) data. It also provides access to On-Demand processing for Sentinel-1, which allows users to generate analysis-ready products such as Radiometric Terrain Corrected (RTC) images or Interferometric SAR (InSAR) interferograms from archived Sentinel-1 data.

ASF provides StoryMap tutorials with step-by-step demonstrations that show how to order On-Demand RTC and On-Demand InSAR products. Additional StoryMap tutorials provide guidance on using the custom ArcGIS Toolbox with RTC products and an exploration of InSAR products and how to interpret and use them.

Using NASA Data in GIS Programs

Adding a Raster Layer | Adding a Vector Layer | Adding a Web Map Service


Adding a Raster Layer

There are a variety of GIS applications available to users. The following examples show screenshots from QGIS, a free and open-source GIS application. Other GIS applications have similar options for adding layers.

Adding a Raster Layer in QGIS

  1. Under Layer/Add Layer, select "Add Raster Layer."
  2. Navigate to the directory location to select the file and click "add."
  3. You may need to modify the projection or symbology, both of which are in the layer properties. Layer properties can be accessed by double-clicking on the layer or by selecting "Layer/Layer properties." "Layer Properties" is the window title within QGIS and "Properties" is the window title in ArcGIS Pro.
  4. Here you can also alter band combinations, adjust brightness, and opt for different color schemes.
  5. At this point, you can visualize your data.

Image caption:  Adjusting Band Rendering and Color Rendering

Image
this is an image of band and color rendering

Image caption:  Adjusting Band Rendering and Color Rendering

Image
this is an image of adjusting band color rendering

Image caption: Adjusting Band Rendering and Color Rendering


Adding a Vector Layer

Adding a Vector Layer in QGIS

  1. Under Layer/Add Layer, select "Add Vector Layer."
  2. Navigate to the directory location to select the file and click "add."  Note: you can add the entire zip file, then select specific layers to add.
  3. At this point, you can visualize your data.
Image
this is an image of adding a vector layer in QGIS


Adding a Web Map Service

Adding a Web Service to a GIS

Web services offer a great way to discover and explore NASA Earth observations without having to download data files. NASA provides a variety of data services in various formats such as Open Geospatial Consortium (OGC) Web Mapping Services (WMS), Web Feature Services (WCS), Web Processing Service (WPS) as well as ArcGIS Image Services.  Below are generic instructions for accessing and using web services within QGIS and ArcGIS tools. See Use Cases for Web Services to see examples for each service.

QGIS:

  1.  Under Layer/Add Layer, select "Add W*S Layer" (* denoting the type of service you plan to connect to)

2. Click "New" to add a new endpoint using the specific URL then click “OK”

3. Click "Connect" to access the services available.

4. Choose the content you desire to view and click “Add” for the service to be brought into your map viewer

Example for bringing in the 1,000+ Global Imagery Browse Service (GIBS) time-enabled OGC WMS endpoint: https://nasa-gibs.github.io/gibs-api-docs/gis-usage/#qgis

Now you can visualize the imagery as well as control the temporal range available for the data collection.

Image
this is an image of the temporal controller

ArcGIS Online (AGOL)

1. From the Map Viewer interface, click “Add”

2. Select the service type (i.e. OGC W*S web service)

3. Enter the endpoint using the specific URL for it to automatically connect

4. Choose the content you desire to view and click “Add to map” for the service to be brought into your map viewer

Example for bringing in the 1,000+ Global Imagery Browse Service (GIBS) time-enabled OGC WMS endpoint: https://nasa-gibs.github.io/gibs-api-docs/gis-usage/#esri-arcgis-online

Now you can visualize the imagery as well as control the temporal range available for the data collection.

ArcGIS Pro:

1. Within the ‘Insert’ tab, click Connections then ‘New *** Server’ (* denoting the type of service you plan to connect to)

2. Add a new endpoint using the specific URL. Click "OK" to connect and access the services available.

3. Open the Catalog pane, view the Project tab to find the Servers list and locate the service you connected to

4. Navigate to the content of interest and click ‘Add to Current Map ’to bring it into your map viewer

Now you can visualize the imagery as well as control the temporal range available for the data collection.

Option 2 (for a single, specific service vs. a catalog of multiple services):

1. Within the ‘Map’ tab, click ‘Add Data’ then ‘Add Data From Path’

2. Add a new endpoint using the specific URL. Click "Add" to connect and access the service

Example for bringing in the 1,000+ Global Imagery Browse Service (GIBS) time-enabled OGC WMS endpoint: https://nasa-gibs.github.io/gibs-api-docs/gis-usage/#esri-arcgis-pro


Use Cases for Web Services

Web Feature Service | Image Service | Web Map Service | Web coverage Service


Web Feature Service

NOTE: The following Use Cases and screenshots are created using QGIS.

Web Feature Service (WFS) from NASA's Socioeconomic Data and Applications Center (SEDAC)

Storm surges from hurricanes pose numerous threats to health and the environment. In areas where U.S. Environmental Protection Agency (EPA) Superfund sites may be inundated, the concern that toxins will be dispersed is great. However, the level of concern varies widely depending on the specific contaminants and their concentrations. The EPA assesses where Superfund sites exist, the vulnerability of these sites, and the risk to surrounding communities when a large storm surge is expected. This use case is adapted from a CNBC news article and the EPA Hurricane Harvey Report.

Concerned about an approaching hurricane expected to hit the panhandle of Florida, you want to look at Superfund sites in the area and the population density surrounding these areas to assess potential effects. Through SEDAC's WFS, you can directly access these data within a GIS.

To add a Web Feature Service:

1. Proceed to Layer and "Add a WFS Layer." Provide a name and insert this URL: https://sedac.ciesin.columbia.edu/geoserver/ows?version=1.1.0

2. You can now access and query the catalog of services available. Identify the content of interest and click to add to the map.

3. Here we bring in SEDAC’s global dams and reservoirs data, Low Elevation Coastal Zone Urban-Rural Population and Land Area Estimates, and EPA Superfund sites along the coast to identify potential impact areas of concerns.


Image Service

This use case focuses on Hurricane Ida, which occurred in August 2021. Hurricane Ida was a deadly and destructive Category 4 Atlantic hurricane that became the second-most damaging hurricane to make landfall in the U.S. state of Louisiana.

The demonstration below uses ArcGIS Pro and an ArcGIS Image Service derived from NASA's Integrated Multi-satellite Retrievals for Global Precipitation Measurement (IMERG) early dataset. This service estimates precipitation rate from multiple sensors and incorporates calibrations from climatological rain gauges.

To add the Image Service:

1. Locate the endpoint found from the public content item page. This page can be found searching NASA’s ArcGIS Online (AGOL) or the Living Atlas of the World repository of global GIS content.

Image
this is an image of GPM IMERG

2. From here you can choose to Open in the tool of your choice, in this case ArcGIS Pro, or copy the endpoint directly:
 
https://arcgis.gesdisc.eosdis.nasa.gov/authoritative/rest/services/GPM_3IMERGHHE_06/ImageServer.

*Note: An ArcGIS Image Connector plugin is available for QGIS. ArcGIS Image Services can also be connected to as a REST service and may have OGC WMS and WCS endpoints available.

3. The next step is to connect to the ArcGIS Image Service:

Open ArcGIS Pro* → Add Data → Data from Path using the URL copied above.

Once added, the data will be visualized on the map

4. Zoom to the area of interest, in this case the U.S. Gulf of Mexico, specifically targeting the state of Louisiana.

5. The image service provides global coverage with temporal span from 06/01/2000 0:00 GMT to present at 30-minute intervals.  Focusing on Hurricane Ida, we want to specify the timeframe we are interested in so the service only displays the data from this event:

6. Open the service Layer Properties from the Content menu. Select Time to establish the Time Extent, in this case: August 29-30, 2021.

7. This will be displayed on the map where you can play through the time series and watch the storm make landfall.

8. To adjust data values and displays, you can adjust or remove the Processing Templates found in the Image Service Layer tab.

9. Using this image service, you can open and employ a variety of Raster Functions that are performed against the service itself. These can be found in the Analysis tab. 

Examples include:

  • Unit Conversion to convert the original Millimeters per Hour to Inches per Hour
  • Clip to set the extent of the data to only use what is displayed in our current map extent

Using these outputs, you can extract values, adjust symbology, convert to polygon, and integrate other data to visualize and analyze relationships, patterns, and impacts.

In this demonstration:

Add Data → Data. Under the Portal section, click to access Living Atlas. Search "bridges" and find the National Bridge Inventory. Add it to our map to identify critical infrastructure that is at risk from this storm.

Visit the Earthdata YouTube GIS playlist to access the following tutorials related to using the NASA Integrated Multi-satellite Retrievals for GPM (IMERG) algorithm to assess Hurricane Ida using GIS tools:

Part 1: Jupyter Notebooks: This demonstration shows how to view an image service and create a custom workflow using that service in a Jupyter Notebook

Part 2: ArcGIS Online (AGOL) and ArcGIS Portal: This video navigates users around the NASA GES DISC ArcGis Portal and provides models on how to open an image service in the Web Map Viewer

Part 3: ArcGIS Pro Processing Templates and Symbology: This tutorial highlights an ArcGIS Pro workflow that imports the image service into ArcGIS Pro using the Add Data option. It also shows how to use ArcGIS Pro’s visualization options to adjust the symbology of the imported web map

Part 4: ArcGIS Pro Raster Functions: This video demonstrates how to change symbology, adjust processing templates, employ raster functions, and perform geoprocessing tasks to analyze data alongside public web services available from Esri’s Living Atlas of the World


Web Map Service

Web Map Service (WMS) – NASA's Global Imagery Browse Services (GIBS)

Globally, fire activity changes along the productivity/aridity gradient. This relation should be driven by differing relative roles of the main fire drivers (weather and fuel) along the productivity gradient. In moist regions, fire activity is believed to be driven by drought frequency; in dry regions, fire is thought to be limited by the amount of fuel available.

You can test these ideas by comparing global fire activity. Using the GIBS WMS within a GIS, you can directly access Moderate Resolution Imaging Spectroradiometer (MODIS) land surface reflectance (Bands 7-2-1) data (which helps distinguish burn scars from naturally low vegetation or bare soil), fire and thermal anomalies data, and normalized difference vegetation index data.

To add a WMS:

1. Proceed to Layer/Add Layer and "Add a WMS/WMTS Layer." Provide a name and insert the following URL: https://gibs.earthdata.nasa.gov/wms/epsg4326/best/wms.cgi

2. In this example, the following layers from GIBS were added:

Thermal Anomalies and Fires (All (day/night)) from the MODIS instrument aboard NASA's Terra satellite, Terra/MODIS 8-day Vegetation Index, Terra/MODIS Land Surface Reflectance (Bands 7-2-1).

3. Many of the imagery visualization layers provided through GIBS are time-varying imagery layers, and the date/time can be changed directly through some GIS applications using the temporal controller or time slider functionality. GIBS provides instructions for enabling this capability, with a fixed temporal range or an animated one, within several GIS applications.


Web coverage Service

Web Coverage Service (WCS) – SEDAC

Approximately half the original wetland habitats in the U.S. have been lost over the past 200 years. While part of this loss is the result of natural evolutionary processes, human activities (such as dredging wetlands for canals or draining and filling wetlands for agriculture, grazing, or development) are responsible for a large contribution to marsh habitat alteration and destruction. Wetlands in the U.S. state of Louisiana represent about 40% of the wetlands in the continental U.S.; however, they account for about 80% of U.S. wetland losses (from Louisiana Coastal Wetlands: A Resource at Risk).

Concerned about a changing climate, you conduct an analysis of coastal wetland loss from sea level rise using estimates of wetland losses as a basis for identifying potential adaptation measures. Through SEDAC's WCS, you can directly access elevation data, population density, and an urban extent grid within a GIS.

To add a WCS:

1. Proceed to Layer and "Add a WCS Layer."

2. Provide a name and insert this URL: https://sedac.ciesin.columbia.edu/geoserver/wcs?


3. In this example, the following SEDAC layers were added:

Global Population of the World, population density for 2020, Low Elevation Coastal Zone areas, Urban Extents, and the  Global Shuttle Radar Topography Mission (SRTM) Elevation above Sea-level at 1 km resolution

4. Click "OK", then click "Connect." Imagery layers can now be added to the map viewer.

5. WCS allow users to adjust symbology and retrieve data values, providing more value beyond a static image.

Web Coverage Service (WCS) - from NASA's Oak Ridge National Laboratory DAAC (ORNL DAAC)

According to NOAA'S Global Annual Temperature Rankings Outlook, the year 2020 was on track to be one of the warmest on record. Concerned about a changing climate, you want to access climatological data and generate an anomaly map for the month of January 2020. ORNL DAAC Spatial Data Access Tool (SDAT) has an interactive interface which provides access to various geospatial data, including OGC web services allow users to select the spatial extent, format, projection and resolution of the data to be previewed and/or downloaded.

Through ORNL DAAC's WCS, you can directly access a data product called Daymet. Daymet is a collection of gridded estimates of daily weather parameters generated by interpolation and extrapolation from daily meteorological observations. Daymet data can be used to run raster-based functions to generate a 28-year time averaged map and then an anomaly map for 2020.

To add a WCS:

1. Proceed to Layer and "Add a WCS Layer." Provide a name and insert the following URL: https://webmap.ornl.gov/ogcbroker/wcs

2. Click "OK", then click "Connect." Coverages can now be added to the map viewer. Users can identify time slices available by selecting the options under “Time”.

3. In this example, the following ORNL DAAC layers were added:

Daymet: Monthly Climate Summaries on a 1-km Grid for North America in 2021: Total Precipitation, Monthly Mean Daily Minimum Temperature, and Monthly Mean Daily Maximum Temperature

4. Then comparing solely Daily Maximum Temperature over 40 years. Using the identify tool you can point and click on a location to retrieve data values. Note: these temperature values are represented in units Celsius.


Getting Help with Data

Check out our GIS page to Discover GIS Content, Explore the Imagery, and Access the Data

Visit the numerous GIS Tutorials/How-Tos and Data Recipes provides tips for transforming data for GIS use.

The Application for Extracting and Exploring Analysis Ready Samples (AρρEEARS) offers a simple and efficient way to access and transform geospatial data from a variety of federal data archives. AρρEEARS enables users to subset geospatial datasets using spatial, temporal, and band/layer parameters. Two types of sample requests are available: point samples for geographic coordinates and area samples for spatial areas via vector polygons.

If you are interested in receiving expert advice, check out the Earthdata Forum, where subject matter experts from NASA data centers are available to discuss general questions, research needs, and data applications (within the “Search by Tags” box, under “Services/Usage” select “GIS Tools” from the dropdown).

While all NASA Earth science data are available without restriction, an Earthdata Login is required to download data and access some resources (including some resources noted in this Data Pathfinder). If you do not already have an Earthdata Login, you can set one up quickly and easily through the Earthdata Login page.


Last Updated
Apr 12, 2022