Some of NASA's Earth Observing System Data and Information System (EOSDIS) Distributed Active Archive Centers (DAACs) provide geospatial services; specifically, web map services (WMS), web map tile services (WMTS), web feature services (WFS), and web coverage services (WCS), providing access to a variety of GIS-ready datasets. Many of the URLs needed for data access are specific to the DAAC, and in some cases specific to the dataset. The sections below provide the datasets available for that given topic and the DAAC responsible for the geospatial service.
Global Imagery Browse Service (GIBS)
Datasets Provided: | Aerosol optical depth/thickness (AOD/AOT), Clouds, Chemistry (Nitrogen Dioxide, Carbon Monoxide, Sulfur Dioxide, Ozone, Water Vapor, Methane), Wind speed, Dust, Humidity, Air Temperature, Radiation, Flux, Lightning, Evaporation, Climatology, Albedo, Particulate Matter |
The GIBS WMS base URL is: https://gibs.earthdata.nasa.gov/wms/INSERT_PROJECTION/best/wms.cgi?SERVICE=WMS&VERSION=INSERT_VERSION&REQUEST=INSERT_REQUEST
- GIBS supporters the following projections for the INSERT_PROJECTION value:
Projection Code for INSERT_PROJECTION WGS 84 / Geographic - EPSG:4326 epsg4326 Web Mercator - EPSG:3857 epsg3857 Arctic polar stereographic - EPSG:3413 epsg3413 Antarctic polar stereographic - EPSG:3031 epsg3031 - GIBS supports 1.1.1 and 1.3.0 for the INSERT_VERSION value
- GIBS supports GetCapabilities and GetMap for the INSERT_REQUEST value
For a complete list of imagery products, see GIBS Available Imagery Products.
Some of NASA's Earth Observing System Data and Information System (EOSDIS) Distributed Active Archive Centers (DAACs) provide geospatial services; specifically, web map services (WMS), web map tile services (WMTS), web feature services (WFS), and web coverage services (WCS), providing access to a variety of GIS-ready datasets. Many of the URLs needed for data access are specific to the DAAC, and in some cases specific to the dataset. The sections below provide the datasets available for that given topic and the DAAC responsible for the geospatial service.
GIBS
Datasets Provided: | Amphibian/Mammal Richness, Normalized Difference Vegetation Index (NDVI), Enhanced Vegetation Index (EVI), Chlorophyll, Photosynthetically Active Radiation (FPAR), Primary Productivity, Leaf Area Index (LAI) |
The GIBS WMS base URL is: https://gibs.earthdata.nasa.gov/wms/INSERT_PROJECTION/best/wms.cgi?SERVICE=WMS&VERSION=INSERT_VERSION&REQUEST=INSERT_REQUEST
- GIBS supporters the following projections for the INSERT_PROJECTION value:
Projection Code for INSERT_PROJECTION WGS 84 / Geographic - EPSG:4326 epsg4326 Web Mercator - EPSG:3857 epsg3857 Arctic polar stereographic - EPSG:3413 epsg3413 Antarctic polar stereographic - EPSG:3031 epsg3031 - GIBS supports 1.1.1 and 1.3.0 for the INSERT_VERSION value
- GIBS supports GetCapabilities and GetMap for the INSERT_REQUEST value
For a complete list of imagery products, see GIBS Available Imagery Products.
Oak Ridge National Laboratory DAAC (ORNL DAAC)
Datasets Provided: | Leaf Area Index (LAI), Conterminous US Above Ground Biomass, Conterminous US Forest Gross Emissions, Conterminous US Forest Litter Carbon Pool, Woody Debris Carbon/Fine Root Carbon, Normalized Difference Vegetation Index (NDVI), Forest Age Distribution, Forest Area, Forest Biomass, Fraction of Photosynthetically Active Radiation (FPAR), Tree Mortality (from Bark Beetles and Fires) |
ORNL DAAC datasets can be accessed directly within a GIS program, by adding a WMS or a WCS layer.
Some of NASA's Earth Observing System Data and Information System (EOSDIS) Distributed Active Archive Centers (DAACs) provide geospatial services; specifically, web map services (WMS), web map tile services (WMTS), web feature services (WFS), and web coverage services (WCS), providing access to a variety of GIS-ready datasets. Many of the URLs needed for data access are specific to the DAAC, and in some cases specific to the dataset. The sections below provide the datasets available for that given topic and the DAAC responsible for the geospatial service.
GIBS
Datasets Provided: | Sea Ice, Snow Depth/Cover, Snow Water Equivalent, Freeze/thaw, Albedo, Ice Surface Temperature, Snow Extent |
The GIBS WMS base URL is: https://gibs.earthdata.nasa.gov/wms/INSERT_PROJECTION/best/wms.cgi?SERVICE=WMS&VERSION=INSERT_VERSION&REQUEST=INSERT_REQUEST
- GIBS supporters the following projections for the INSERT_PROJECTION value:
Projection Code for INSERT_PROJECTION WGS 84 / Geographic - EPSG:4326 epsg4326 Web Mercator - EPSG:3857 epsg3857 Arctic polar stereographic - EPSG:3413 epsg3413 Antarctic polar stereographic - EPSG:3031 epsg3031 - GIBS supports 1.1.1 and 1.3.0 for the INSERT_VERSION value
- GIBS supports GetCapabilities and GetMap for the INSERT_REQUEST value
For a complete list of imagery products, see GIBS Available Imagery Products.
National Snow and Ice Data Center DAAC (NSIDC DAAC)
Datasets Provided: | Sea Ice (Concentration, Extent, Age), Greenland Melt, Glaciers |
NSIDC DAAC datasets can be accessed directly within a GIS program, by adding a WMS layer as https://nsidc.org/api/mapservices/NSIDC/ows?version=1.3.0.
Glaciers specific: http://www.glims.org/mapservice/
Some of NASA's Earth Observing System Data and Information System (EOSDIS) Distributed Active Archive Centers (DAACs) provide geospatial services; specifically, web map services (WMS), web map tile services (WMTS), web feature services (WFS), and web coverage services (WCS), providing access to a variety of GIS-ready datasets. Many of the URLs needed for data access are specific to the DAAC, and in some cases specific to the dataset. The sections below provide the datasets available for that given topic and the DAAC responsible for the geospatial service.
GIBS
Datasets Provided: | Land Surface Temperature, Precipitation/Rain, Sea Surface Temperature, Water Vapor, Soil Moisture, Dams and Reservoirs, Freeze/thaw, Chlorophyll, Cyclone/Flood Hazards, Sea Surface Currents, Sea Surface Salinity, Sea Surface Height |
The GIBS WMS base URL is: https://gibs.earthdata.nasa.gov/wms/INSERT_PROJECTION/best/wms.cgi?SERVICE=WMS&VERSION=INSERT_VERSION&REQUEST=INSERT_REQUEST
- GIBS supporters the following projections for the INSERT_PROJECTION value:
Projection Code for INSERT_PROJECTION WGS 84 / Geographic - EPSG:4326 epsg4326 Web Mercator - EPSG:3857 epsg3857 Arctic polar stereographic - EPSG:3413 epsg3413 Antarctic polar stereographic - EPSG:3031 epsg3031 - GIBS supports 1.1.1 and 1.3.0 for the INSERT_VERSION value
- GIBS supports GetCapabilities and GetMap for the INSERT_REQUEST value
For a complete list of imagery products, see GIBS Available Imagery Products.
Physical Oceanography DAAC (PO.DAAC)
Datasets Provided: | Geodetics Gravity, Ocean Circulation, Ocean Temperature, Ocean Winds, Salinity/Density, Sea Surface Topography |
Thematic Real-time Environmental Distributed Data Services (THREDDS) Data Server (TDS) is a web server that provides metadata and data access for scientific oceanography datasets, using a variety of remote data access protocols, including WMS. A list of existing GIS-ready datasets can be found at the TDS Catalog. Drill down within your area of interest and a WMS and a WCS URL will be provided.
ORNL DAAC
Datasets Provided: | Surface Water Extent (Boreal Regions), Amazon Rainfall/Wetlands, Precipitation, Wet Day Frequency, Lakes, Last Day of Spring Snow, Land Surface Fractional Open Water, Daymet Climatology |
ORNL DAAC datasets can be accessed directly within a GIS program, by adding a WMS or a WCS layer.
Some of NASA's Earth Observing System Data and Information System (EOSDIS) Distributed Active Archive Centers (DAACs) provide geospatial services; specifically, web map services (WMS), web map tile services (WMTS), web feature services (WFS), and web coverage services (WCS), providing access to a variety of GIS-ready datasets. Many of the URLs needed for data access are specific to the DAAC, and in some cases specific to the dataset. The sections below provide the datasets available for that given topic and the DAAC responsible for the geospatial service.
GIBS
Datasets Provided: | Elevation, Soil Moisture, Surface Reflectance, Land Surface Temperature, Thermal Anomalies and Fires, Land Cover/Land Use, Drought, Landslide/Volcano Hazards |
The GIBS WMS base URL is: https://gibs.earthdata.nasa.gov/wms/INSERT_PROJECTION/best/wms.cgi?SERVICE=WMS&VERSION=INSERT_VERSION&REQUEST=INSERT_REQUEST
- GIBS supporters the following projections for the INSERT_PROJECTION value:
Projection Code for INSERT_PROJECTION WGS 84 / Geographic - EPSG:4326 epsg4326 Web Mercator - EPSG:3857 epsg3857 Arctic polar stereographic - EPSG:3413 epsg3413 Antarctic polar stereographic - EPSG:3031 epsg3031 - GIBS supports 1.1.1 and 1.3.0 for the INSERT_VERSION value
- GIBS supports GetCapabilities and GetMap for the INSERT_REQUEST value
For a complete list of imagery products, see GIBS Available Imagery Products.
ORNL DAAC
Datasets Provided: | Ground Frost Frequency, Runoff Sub-basins, Land Cover, Land Surface Monthly, Evapotranspiration, Soil Types, Diurnal/Mean Temperature, Surface Skin Temperature, Snow Free Albedo, Normalized Burn Ratio |
ORNL DAAC datasets can be accessed directly within a GIS program, by adding a WMS or a WCS layer.
- WMS: http://webmap.ornl.gov/ogcbroker/wms?service=WMS&version=1.1.1&request=GetCapabilities
- WCS: https://webmap.ornl.gov/ogcbroker/wcs?
ASF DAAC
Radiometric Terrain Corrected (RTC) Sentinel-1 data and RGB Decomposition images derived from the RTC, have been processed by ASF. The area of interest is the eastern coastal region of the United States, commonly impacted by hurricane activity. To access these services, add the following as ArcGIS Map Services.
- RGB Decomposition: https://asf.img.arcgis.com/arcgis/rest/services/ASF_RTC/ASF_S1_RGB/ImageServer
- RTC (dual-band VV and VH): https://asf.img.arcgis.com/arcgis/rest/services/ASF_RTC/ASF_S1_RTC/ImageServer
Some of NASA's Earth Observing System Data and Information System (EOSDIS) Distributed Active Archive Centers (DAACs) provide geospatial services; specifically, web map services (WMS), web map tile services (WMTS), web feature services (WFS), and web coverage services (WCS), providing access to a variety of GIS-ready datasets. Many of the URLs needed for data access are specific to the DAAC, and in some cases specific to the dataset. The sections below provide the datasets available for that given topic and the DAAC responsible for the geospatial service.
GIBS
Datasets Provided: | Agriculture, Population, Urban Extent, Human Footprint, Man-Made Impervious, Built-up Settlement, Cyclone/Drought/Flood Hazards, Power Plants, Nighttime Lights |
The GIBS WMS base URL is: https://gibs.earthdata.nasa.gov/wms/INSERT_PROJECTION/best/wms.cgi?SERVICE=WMS&VERSION=INSERT_VERSION&REQUEST=INSERT_REQUEST
- GIBS supporters the following projections for the INSERT_PROJECTION value:
Projection Code for INSERT_PROJECTION WGS 84 / Geographic - EPSG:4326 epsg4326 Web Mercator - EPSG:3857 epsg3857 Arctic polar stereographic - EPSG:3413 epsg3413 Antarctic polar stereographic - EPSG:3031 epsg3031 - GIBS supports 1.1.1 and 1.3.0 for the INSERT_VERSION value
- GIBS supports GetCapabilities and GetMap for the INSERT_REQUEST value
For a complete list of imagery products, see GIBS Available Imagery Products.
ORNL DAAC
Datasets Provided: | Crops, Drought Code/Severity Index, Population Density |
ORNL DAAC datasets can be accessed directly within a GIS program, by adding a WMS or a WCS layer.
- WMS: http://webmap.ornl.gov/ogcbroker/wms?service=WMS&version=1.1.1&request=GetCapabilities
- WCS: https://webmap.ornl.gov/ogcbroker/wcs?
Socioeconomic Data and Applications Center (SEDAC)
Datasets Provided: | Human Footprint, Anthropogenic Biomes, Development Threat, Cyclone/Drought/Flood/Earthquake/Landslide/Volcano Hazards, Population Count/Density, Urban Extent, Fertilizers, Statistical Areas |
SEDAC datasets can be accessed directly within a GIS program, by adding an ArcGIS Web Service:https://sedac.ciesin.columbia.edu/arcgis/rest/services/sedac
Measurements: Snow Cover, Surface Reflectance, Land Surface Temperature, Global Digital Elevation Model, Evapotranspiration, Normalized Difference Vegetation Index/ Enhanced Vegetation Index, Leaf Area Index, Evapotranspiration, Gross Primary Productivity/ Net Primary Productivity, Fraction of Photosynthetically Active Radiation, Evaporative Stress Index, Carbon Net Ecosystem Exchange, Water Use Efficiency, Freeze/Thaw, Soil Moisture
AppEEARS, from NASA's Land Processes DAAC (LP DAAC), offers a simple and efficient way to access and transform geospatial data from a variety of federal data archives. AppEEARS enables users to subset geospatial datasets using spatial, temporal, and band/layer parameters. Two types of sample requests are available: point samples for geographic coordinates and area samples for spatial areas via vector polygons.
Performing Area Extractions
After choosing to request an area extraction, you will be taken to the Extract Area Sample page where you will specify a series of parameters that are used to extract data for your area(s) of interest.
Spatial Subsetting
You can define your region of interest in three ways:
- Upload a vector polygon file in shapefile format (you can upload a single file with multiple features or multipart single features). Files in .shp, .shx, .dbf, or .prj format must be zipped into a file folder to upload.
- Upload a vector polygon file in Geographic JavaScript Object Notation (GeoJSON) format (can upload a single file with multiple features or multipart single features).
- Draw a polygon on the map by clicking on the Bounding box or Polygon icons (single feature only).
Select the date range for your time period of interest.
Specify the range of dates for which you wish to extract data by entering a start and end date (MM-DD-YYYY) or by clicking on the Calendar icon and selecting dates a start and end date in the calendar.
Adding Data Layers
Enter the product short name (e.g., MOD09A1, WELDUSMO), keywords from the product long name, a spatial resolution, a temporal extent, or a temporal resolution into the search bar. A list of available products matching your query will be generated. Select the layer(s) of interest to add to the Selected layers list. Layers from multiple products can be added to a single request. Be sure to read the list of available products available through AppEEARS.
Selecting Output Options
Two output file formats are available:
- GeoTIFF
- NetCDF4
If GeoTIFF is selected, one GeoTIFF will be created for each feature in the input vector polygon file for each layer by observation. If NetCDF4 is selected, outputs will be grouped into files in .nc format by product and by feature.
Interacting with Results
Once your request is completed, from the Explore Requests page, click the View icon in order to view and interact with your results. This will take you to the View Area Sample page.
The Layer Stats plot provides time series boxplots for all of the sample data for a given feature, data layer, and observation. Each input feature is renamed with a unique AppEEARS ID (aid). If your feature contains attribute table information, you can view the feature attribute table data by clicking on the Information icon to the right of the Feature dropdown. To view statistics from different features or layers, select a different aid from the Feature dropdown and/or a different layer of interest from the Layer dropdown.
Be sure to check out the AppEEARS documentation to learn more about downloading the output files in GeoTIFF or NetCDF4 format. Once downloaded, datasets in GeoTIFF and NetCDF format can be opened in a GIS by adding a raster layer. An example of doing this in QGIS is below.
Measurements: Fire/Thermal Anomalies, Burned Area
The Fire Information for Resource Management System (FIRMS) distributes Near Real-Time (NRT) active fire data within 3 hours of satellite observation from the Moderate Resolution Imaging Spectroradiometer (MODIS) aboard the Aqua and Terra satellites, and the Visible Infrared Imaging Radiometer Suite (VIIRS) aboard S-NPP and NOAA 20 (formally known as JPSS-1).
There are two primary ways of exploring NRT fire data through FIRMS: through an interactive map or by direct download of the NRT data. The interactive map provides NRT and the full archive of global MODIS and VIIRS fire locations. It also enables users to view the MODIS Terra/Aqua Global Burned Area data product (with an approximate 4-month lag between the date of burn and burned area data product in FIRMS).
LANCE FIRMS developers partnered with the USDA Forest Service’s Geospatial Technology and Applications Center (GTAC) to create FIRMS US/Canada, a new and expanded version of FIRMS. In addition to the standard FIRMS, FIRMS US/Canada meets the new Forest Service requirements by offering additional contextual layers and enhancements, including classifying fires to show time since detection to depict active fire fronts, incident locations and other information for current large fires in the US and Canada. FIRMS US/Canada provides current and historical corrected reflectance imagery from NASA and NOAA satellites, US and Canada administrative ownership boundaries, daily fire danger forecasts, and current National Weather Service fire weather watch and red flag warning areas.
Measurements: Air Temperature, Relative Humidity, Cloud Fraction, Cloud Top Temperature/ Pressure, Total Column Water Vapor and Ozone, Mole Fraction in Air of CO2, CO, CH4, O3, Wind Speed, Volumetric Soil Moisture, Sea Surface Salinity
NASA's Goddard Earth Sciences Data and Information Services Center (GES DISC) Giovanni is an online environment for the display and analysis of geophysical parameters. There are many options for analysis. The following are several more popular ones:
- Time-averaged maps are a simple way to observe the variability of data values over a region of interest.
- Map animations are a means to observe spatial patterns and detect unusual events over time.
- Area-averaged time series are used to display the value of a data variable that has been averaged from all the data values acquired for a selected region for each time step.
- Histogram plots are used to display the distribution of values of a data variable in a selected region and time interval.
For each of these options, the data can be downloaded in GeoTIFF or KMZ format.
Files in GeoTIFF format can be added to a GIS program by adding a raster layer.
For more detailed tutorials:
- Giovanni How-To's on GES DISC's YouTube channel.
- GES DISC How-To's on importing data into ArcGIS.
Measurements: Vegetation Indices, Thermal Anomalies and Fire, Surface Reflectance, Net Primary Productivity, Evapotranspiration, Leaf Area Index, Land Surface temperature, Gross Primary Productivity, Burned Area, Albedo
ORNL DAAC also has several MODIS and VIIRS Subset Tools for subsetting data.
- With the Global Subset Tool, you can request a subset for any location on earth, provided in GeoTIFF and text format, including interactive time-series plots and more. Users specify a site by entering the site's geographic coordinates and the area surrounding that site, from one pixel up to 201 x 201 km. From the available datasets, you can specify a date and then select from MODIS Sinusoidal Projection or Geographic Lat/long. You will need to register for an Earthdata Login to request data. Once downloaded, files in GeoTIFF format can be added to a GIS program by adding a raster layer. See an example of doing this in QGIS in the section "Adding a Raster Layer to a GIS".
- With the Fixed Subsets Tool, you can download pre-processed subsets for 2000+ field and flux tower sites for validation of models and remote sensing products. The goal of the Fixed Sites Subsets Tool is to prepare summaries of selected data products for the community to characterize field sites. Data are provided as CSV and JSON file formats. CSV files can be added to a GIS program by adding a raster layer. See an example of doing this in QGIS in the section "Adding a Delimited Text Layer to a GIS".
Global Subset:
Measurements: Glacial extent, Brightness temperature, glaciers, ice sheets, permafrost, sea ice, soil moisture, snow
The Global Land Ice Measurements from Space (GLIMS) Initiative has repeatedly surveyed the world's estimated 200,000 glaciers. GLIMS uses data collected by the Advanced Spaceborne Thermal Emission and Reflection Radiometer (ASTER) instrument aboard the Terra satellite and the Landsat series of satellites, along with historical observations. Each polygon within the Glacier Outlines layer represents the extent of a particular glacier at a specific time, as well as other possible features of the glacier such as the extent of debris cover or the location of supra-glacial and pro-glacial lakes.
The GLIMS Glacier outlines can be downloaded as Esri Shapefiles, MapInfo tables, GML, KML, Google Earth, and GMT multi-segment format. Shapefiles and GML can be opened as a vector layer.
NSIDC DAAC has many datasets available in GIS-ready formats (shapefiles, GeoTIFF, ASCII, etc.). WIthin “Data Sets for Research,” you can search on a specific topic, including brightness temperature, glaciers, ice sheets, permafrost, sea ice, soil moisture, and snow. Selecting one of those will then allow you to further filter by format.
Measurements: Air Quality, Agriculture (Global Agricultural Lands: Croplands/ Pastures, Crop Climate, Nitrogen Fertilizer, Nitrogen in Manure, Phosphorus Fertilizer, Phosphorus in Manure), Anthropogenic Biomes, Environmental Performance Index (2010, 2014, 2016 and 2018), Population, Disaster-related, GRACE Freshwater Availability Trends
NASA's Socioeconomic and Data Applications Center (SEDAC) has a mission to synthesize Earth science and socioeconomic data and information in ways useful to a wide range of decision-makers and other applied users. Most of the datasets can be downloaded in GeoTIFF, ASCII, or NetCDF format. These datasets can be opened in a GIS by adding a raster layer. See examples of doing these in QGIS in the sections "Adding a Raster Layer to a GIS" or if CSV, "Adding a Delimited Text Layer to a GIS". In addition, much of the SEDAC data are displayed as Vector features so they can be more easily ingested into GIS tools (not as Raster type).
Within SEDAC's Map Viewer, you can view up to 4 SEDAC map layers, either as four separately synched maps or as overlays in a single map:
The SEDAC Hazards Mapper enables users to visualize data and map layers related to Socioeconomic, Infrastructure, Natural Disasters, and Environment and analyze potential impacts and exposure.
Measurements: Solar insolation / radiation, wind speed, temperature, specific/relative humidity, precipitation, cooling/heating degree days, thermal zones
The POWER data portal provides direct access to NASA's solar insolation and meteorological data parameters customized for application to the Sustainable Buildings (SB), Agroclimatology (AG), and Renewable Energy (SSE) communities. Within each community, parameters can be accessed with a temporal averaging period of Daily, Interannual, or Climatological. The daily time period can be used to download the time series of the daily averaged values of the selected parameters over the selected time period. The interannual time period can be used to download a time series of the monthly averaged value of the selected parameter for each year in a selectable time period. The climatological time period gives the monthly climatological average for each selected parameter over a climatological time period (currently set by default to July 1983–June 2005).
You can access the data regionally, globally, or even by a single latitude/longitude. For regional or global access:
- Select community (SSE, AG, SB)
- Choose a temporal average
- Enter a region of interest and the time extent
- Output formats available are ASCII, CSV, GeoJSON, and NetCDF
- Select Parameters and Submit.
Files can be opened either as a delimited text layer or as a raster layer (depending on type). See examples of doing these in QGIS in the sections Adding a Raster Layer to a GIS and Adding a Delimited Text Layer to a GIS.
For single point access:
- Select community (SSE, AG, SB)
- Choose a temporal average
- Enter a region of interest and the time extent
- Output formats available are ASCII, CSV, GeoJSON, and NetCDF
- Select Parameters and Submit.
Files can be opened either as a delimited text layer or as a raster layer (depending on type).
Measurements: Normalized Difference Vegetation Index (NDVI), Thaw Depth, Burn Severity, Aboveground Biomass, Fractional Open Water, Land Cover, Surface Water Extent, 30 year mean monthly climatology, 10 year mean monthly climatology, monthly precipitation, atmospheric nitrogen deposition, aboveground biomass, ecosystem functional type, tree canopy cover, carbon dioxide emissions, leaf area index, soil properties, Wetland extent, forest cover, land cover, digital elevation model, vegetation and soils, SAR wetland masks, soil properties, hydrologic maps
ORNL DAAC's SDAT is an Open Geospatial Consortium standards-based web application to visualize and download spatial data in various user-selected spatial/temporal extents, file formats, and projections. Several datasets including land cover, biophysical properties, elevation, and selected ORNL DAAC archived data are available through SDAT. KMZ files are also provided for data visualization in Google Earth.
Within SDAT, select a dataset of interest. Upon selection, the map will open displaying the various measurements, with the associated granule, and a visualization of the selected granule.
You can then select your spatial extent, projection and output format for downloading.
File formats available are ArcInfo ASCII Grid, GeoTIFF, and NetCDF, all of which can be opened as a raster layer in the GIS program.
Some of the inventory-based datasets are available for download as shapefiles, GeoJSON, and KML—all of which can be added as a vector layer in the GIS program. They also are available as CSV, which can be added as a delimited text file; you will just need to specify the number of header lines, if any, to disregard and specify the appropriate latitude and longitude columns as x and y fields.
Measurements: Total water storage anomaly, ocean color chlorophyll-A, ocean surface current speed and vectors, ocean surface wind speed and vectors, sea ice concentration, sea surface height, sea surface salinity, sea surface temperature, soil moisture, surface precipitation rate
SOTO is an interactive web-based tool, created by NASA's Physical Oceanography DAAC (PO.DAAC) to generate informative maps, animations, and plots that communicate and prove the discovery and analysis of the state of the oceans.
The suite of tools provide access to a broad range of satellite-derived products and key parameters of interest to the oceanographic community.
Measurements: Synthetic Aperture Radar (SAR)
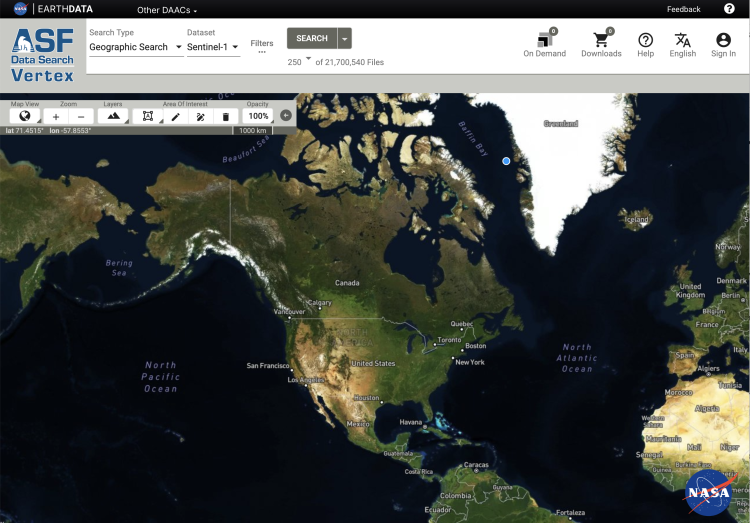
Vertex is a data search tool, created by NASA's Alaska Satellite Facility DAAC (ASF DAAC), that provides access to a wide array of SAR data. Once downloaded, ASF DAAC has developed an ArcGIS Desktop SAR Toolbox for use with either ArcGIS Desktop or ArcGIS Pro, containing tools that perform geoprocessing tasks useful for working with SAR data. The tools were designed to be used with Radiometric Terrain Corrected (RTC) SAR datasets, but several of the tools have the potential to be used with a variety of rasters, including non-SAR datasets.
NASA's ASF DAAC has a story map, Exploring Sentinel-1 InSAR, which focuses on the data contained in ASF's On-Demand Sentinel-1 InSAR product packages and how to work with it.