NASA's Land, Atmosphere Near real-time Capability for EOS (LANCE) provides data to the public within three hours of satellite observation, which allows for near real-time (NRT) monitoring and decision making. The MODIS instrument aboard NASA’s Terra and Aqua satellites and the VIIRS instrument aboard the joint NOAA/NASA Suomi National Polar-orbiting Partnership (Suomi NPP) and NOAA-20 satellites provide information on the location of a wildfire or thermal anomaly along with smoke plume movement.
NRT products are created using predicted geolocation values to enable them to be available rapidly after acquisition. As such, they are not considered research quality data. Standard data products intended for scientific research are available approximately two to three months after raw data collection due to their extensive processing.
Suspended particles in the air that are made up of smoke and dust from burning fires can be tracked and measured by instruments aboard Earth observing satellites. MODIS or VIIRS imagery enable the movement of smoke plumes to be tracked. The NASA Worldview satellite imagery exploration tool enables users to interactively browse more than 1,000 global, full-resolution satellite imagery layers and download the underlying data. Many of the imagery layers are updated within three hours of observation.
For a tutorial see Getting Started with NASA Worldview. Worldview has updated the Satellite Detections of Fire Tour Story that highlights products like vector layers, the PyroCumuloNimbus (pyroCb) Aerosol Index, the Blue/Yellow Composite Day/Night Band, and the GOES-West GeoColor animation of wildfires.
MODIS and VIIRS surface reflectance data provide a means to measure the spatial distribution and intensity of smoke plumes. A high resolution option is Harmonized Landsat and Sentinel-2 (HLS) imagery. HLS provides consistent surface reflectance and top of atmosphere brightness data from the OLI and OLI-2 instruments aboard the joint NASA/USGS Landsat 8 (OLI) and Landsat 9 (OLI-2) satellites and the Multi-Spectral Instrument (MSI) aboard the ESA (European Space Agency) Copernicus Sentinel-2A and Sentinel-2B satellites. The combined measurement enables global land observations every 2–3 days at 30 m spatial resolution.
- MODIS Corrected Reflectance in Worldview
The MODIS Corrected Reflectance imagery is available only as near real-time imagery. The MODIS Corrected Reflectance algorithm utilizes MODIS Level 1B data (the calibrated, geolocated radiances). It is not a standard, research quality product. The purpose of this algorithm is to provide natural-looking images by removing gross atmospheric effects, such as Rayleigh scattering, from MODIS visible bands 1-7. - VIIRS Corrected Reflectance in Worldview
The VIIRS Corrected Reflectance imagery is available only as near real-time imagery. - HLS Surface Reflectance in Worldview
Geostationary Imagery
Unlike Earth-orbiting satellites like Terra and Aqua, geostationary satellites circle Earth at the same speed the planet is rotating. As such, they appear to remain fixed in place over one location. The joint NASA/NOAA GOES-East satellite is centered on 75.2ºW longitude and acquires imagery covering the Conterminous U.S., Canada, and Central and South America (along with most of the Atlantic Ocean). The joint NASA/NOAA GOES-West is centered on 137.2ºW longitude and acquires imagery covering most of the Pacific Ocean, the U.S., most of Canada, Central America, the western half of South America, and parts of Australasia. The Japan Meteorological Agency Himawari-8 satellite is in a geostationary orbit at 140.7ºE longitude and acquires imagery covering most of the Pacific Ocean, a portion of Eastern Asia, and parts of Australasia. Data from all three satellites are acquired every 10 minutes and are available on a rolling 30-day window. The red visible imagery layer of geostationary satellites (which primarily is used to monitor the evolution of clouds) can be used to track smoke plume movement. Note: The Red Visible imagery is only viewable during the day time. Change the time in the Worldview timeline if the imagery is black over your area of interest.
- GOES Red Visible in Worldview
Imagery is available from January 2020 to present. - Himawari Red Visible in Worldview
Aerosol Index (AI)
Aerosols are fine suspended particles (like smoke or ash) that absorb and scatter incoming sunlight. This absorption and scattering of light reduces visibility and increases the optical depth. Satellite-derived aerosol index (AI) products are useful for identifying and tracking the long-range transport of smoke from wildfires or biomass burning. AI indicates the presence of ultraviolet (UV)-absorbing aerosols; the higher the AI, the higher the concentration in the atmosphere. Currently, there are two near real-time AI data products available: one from the Ozone Monitoring Instrument aboard NASA’s Aura satellite and one from the Ozone Mapping and Profiler Suite (OMPS) aboard the joint NASA/NOAA Suomi NPP satellite. For both satellites, the spatial resolution is 2 km and the temporal resolution is daily.
- OMI AI in Worldview
- OMPS AI in Worldview
AI from OMPS also includes the PyroCumuloNimbus (pyroCb) product, which makes it easier to track the extent and spread of smoke from wildfires, volcanic eruptions, and other events that create exceptionally high AI values. Typically the AI signal remains below 5.0 for most smoke and dust events and the OMPS AI product with an AI range of 0.0 to 5.0 satisfies the needs of most users. However, the AI signal for pyroCb events, which are both dense and high in the atmosphere, easily can be much higher than 5.0, and the pyroCb product has an AI range from 0 to >=50.
Aerosol Optical Depth (AOD)
Aerosol optical depth (AOD) is a measure of the level to which aerosols prevent light from traveling through the atmosphere. From an observer on the ground, an AOD of less than 0.1 is characteristic of clear blue sky, bright Sun, and maximum visibility. As AOD increases to 0.5, 1.0, and greater than 3.0, aerosols become so dense that the Sun is obscured.
- MODIS AOD in Worldview
Aqua and Terra's MODIS Combined Value-Added Aerosol Optical Depth layer is a value-added layer based on MODIS Level 2 aerosol products. The layer can give a quick, synoptic view of the level of aerosols in the atmosphere. - MODIS Deep Blue AOD in Worldview
Deep Blue AOD layer is useful for studying aerosol optical depth over land surfaces. This layer is created from the Deep Blue algorithm. - Aerosol Robotic Network (AERONET)
Ground-based AOD measurements are available online at the Aerosol Robotic Network (AERONET).
Trace Gases from Fires
In addition to aerosols, numerous trace gases are found in the atmosphere during and after a fire event. These trace gases, like carbon monoxide (CO) and sulfur dioxide (SO2), are harmful pollutants that can impact public health. Data for trace gases are available from several satellites. For CO, the Atmospheric Infrared Sounder (AIRS) aboard NASA’s Aqua satellite provides the best global coverage at 2 km resolution and twice daily measurements (day and night). AIRS also provides measurements of SO2. Two other instruments, OMI and OMPS (described above) provide information on SO2 in the lower troposphere, middle troposphere, and upper troposphere/stratosphere.
- AIRS L2 CO (Day/Night) in Worldview
CO in units of parts per billion by volume at the 500 hPa pressure level, approximately 5,500 meters (18,000 feet) above sea level. AIRS Level 2 data are nominally 45 km/pixel at the equator and the data have been resampled into a 32 km/pixel visualization. - AIRS SO2 in Worldview
Indicates SO2 column amounts in the atmosphere, measured in Dobson Units (DU). - OMI/OMPS SO2 in Worldview
Indicates the column density of SO2 at different layers of the atmosphere and is measured in Dobson Units (DU). OMI data are available from 2005-present and OMPS from 2012-present.
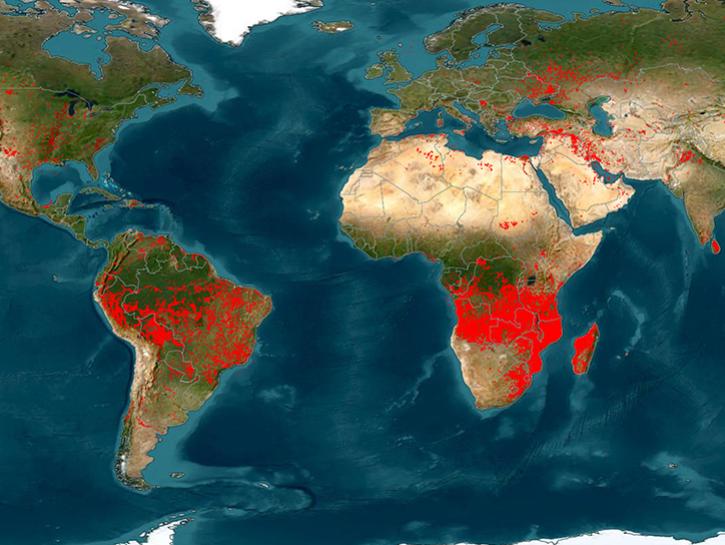
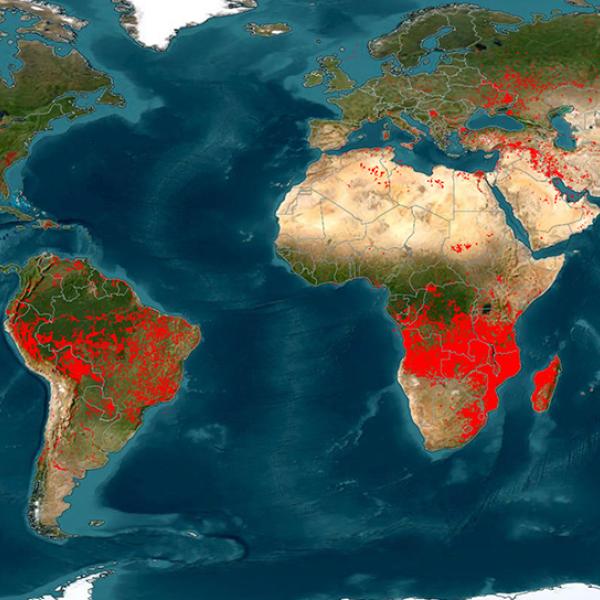
MODIS and VIIRS both provide location information for hotspots and other thermal anomalies, which generally indicate the approximate location of one or more active fires. MODIS and VIIRS true color reflectance imagery can aid in tracking smoke plume movement. It is important to note that MODIS and VIIRS have different spatial and temporal resolutions, which impact the fire data acquired from these instruments. MODIS data are at 1 km and are acquired daily (Terra passes over the equator around 10:30 a.m., Mean Local Time (MLT); Aqua passes over the equator around 1:30 p.m., MLT). VIIRS data are at 375 m and are acquired daily, with improved nighttime performance over MODIS. Suomi NPP crosses the equator at 1:30 a.m. and 1:30 p.m., MLT. NOAA-20 follows the same orbital track as Suomi NPP, but lags behind by about 50 minutes, crossing the equator at 2:20 a.m. and 2:20 p.m., MLT.
Thermal anomalies detected by MODIS and VIIRS are determined by a contextual algorithm that utilizes the infrared or thermal radiation emitted by hotspots or fires. Each detected MODIS active fire represents the center of a 1 km pixel that is flagged by the algorithm as containing one or more fires within the pixel (see figure to right). The higher resolution of VIIRS enables it to detect fires that MODIS might not be able to sense at its lower resolution, especially fires covering relatively small areas.
There are two primary ways of exploring NRT fire data through the Fire Information for Resource Management System (FIRMS): Through the FIRMS interactive map or by direct download of the NRT data. The FIRMS interactive map provides NRT data along with the full archive of global MODIS and VIIRS fire locations. It also enables users to view the MODIS Terra/Aqua Global Burned Area data product (with an approximate 4-month lag between the date of burn and the availability of the burned area data product in FIRMS).
LANCE FIRMS developers partnered with the U.S. Forest Service’s Geospatial Technology and Applications Center to create FIRMS US/Canada. In addition to the standard FIRMS, FIRMS US/Canada meets updated Forest Service requirements by offering additional contextual layers and enhancements, including classifying fires to show time since detection to depict active fire fronts, incident locations, and other information for current large fires in the U.S. and Canada. FIRMS US/Canada provides current and historical corrected reflectance imagery from NASA and NOAA satellites, U.S. and Canadian administrative ownership boundaries, daily fire danger forecasts, and current National Weather Service fire weather watch and red flag warning areas.
Active fire data are available for download for any area of interest in NRT and from the full archive. Within Worldview, fire and thermal anomalies are provided as vector layers, which have attribute information that can be examined when a vector feature is clicked (you may have to zoom in on the Worldview map to make the vector layer active, which is indicated by the vector layer pointer icon turning blue in the thermal anomaly layer). When a detected thermal anomaly point for MODIS (orange dot) or VIIRS (red dot) is selected and the vector layer is active, a table of attributes appears that includes latitude, longitude, brightness temperature, and fire radiative power.
- FIRMS Global Active Fire Data
Downloadable as shapefiles, KML, and text files for the last 24, 48 hours, and 7 days. The full archive of NRT and standard (research quality) data are available from the FIRMS Download Archive. - FIRMS US/Canada Active Fire Data
- MODIS Active Fire and Thermal Anomalies in Worldview
- Suomi NPP VIIRS Active Fire and Thermal Anomalies in Worldview
- NOAA-20 VIIRS Active Fire and Thermal Anomalies in Worldview
Research quality data products can be accessed via Earthdata Search.
- MODIS Active Fire and Thermal Anomalies from Earthdata Search
Data are available daily and 8-day - Suomi NPP VIIRS Active Fire and Thermal Anomalies from Earthdata Search
For a tutorial on using FIRMS data, see the webinar Discover FIRMS on NASA's Earthdata YouTube channel. For more in depth information about FIRMS read the FIRMS Frequently Asked Questions.
NASA Applied Sciences Wildfire Products
NASA's Earth Science Applied Sciences Program has a number of resources relevant to wildfire. The Applied Sciences Wildfire program area provides applications and tools to help communities manage the impacts of fire and is part of a network of collaborators working to reduce wildfire risks before, during, and after events.
The Applied Sciences Disasters program area is the home to the NASA Disasters Mapping Portal: Wildfires. The portal provides links to NASA Disasters program resources and features Event Response Story Maps, Event Response galleries, smoke plume height examples, and wildfire damage proxy maps.
The Lightning Imaging Sensor (LIS) installed on the International Space Station (ISS) records the time of occurrence of a lightning event, measures the radiant energy, and estimates the location during both day and night conditions with high detection efficiency.
- ISS LIS Flash Count in Worldview (Note: LIS Flash Count and Flash Radiance version 1 imagery layers are no longer available. Version 2 imagery will be available in Worldview in the coming months. Version 2 LIS data may be downloaded from LANCE.)
- NRT ISS LIS Browse Images from NASA's Global Hydrometeorology Resource Center Distributed Active Archive Center (GHRC DAAC)
Many factors contribute to a fire’s formation, its intensity, and its behavior. These factors include vegetative health, precipitation, land surface temperature, soil moisture, topography, and wind. Continually monitoring factors that can contribute to a wildfire, such as changes in soil moisture before a fire or precipitation moving into a region, can aid in predicting fire formation and fire behavior. NASA has several datasets that can help with these predictions.
Vegetation indices have been developed to measure the amount of green vegetation over a given area, and can be used to assess vegetative health. One commonly used vegetation index is the Normalized Difference Vegetation Index (NDVI), which ranges in value from -1 to 1. Low values of NDVI generally correspond to barren areas of rock, sand, exposed soils, or snow. Increasing NDVI values indicate greener vegetation including forests, croplands, and wetlands.
Vegetation data products produced from data acquired by the MODIS instrument aboard NASA’s Aqua and Terra satellites and by the VIIRS instrument aboard the joint NASA/NOAA Suomi NPP satellite can be accessed several ways.
MODIS NDVI imagery can be accessed through NASA Worldview:
Data products can be visualized as a time-averaged map, an animation, seasonal maps, scatter plots, or a time series through an online interactive tool called Giovanni. Follow these steps to plot data in Giovanni: 1) Select a map plot type. 2) Select a date range. Data are in multiple temporal resolutions, so be sure to note the start and end date to ensure you access the desired dataset. 3) Check the box of the variable in the left column that you would like to include and then plot the data. For more information on choosing a type of plot, see the Giovanni User Manual. Note: An Earthdata Login is required to use Giovanni.
Research quality data products can be accessed directly using Earthdata Search. Datasets are available in HDF format, which can be opened using NASA’s Panoply data viewer. Note: An Earthdata Login is required to download data from Earthdata Search.
Data from NASA’s Precipitation Measurement Missions (PMM) span more than 20 years, and include data from the joint NASA/Japan Aerospace Exploration Agency (JAXA) Tropical Rainfall Measuring Mission (TRMM; operational 1997 to 2015) and Global Precipitation Mission (GPM; operational 2014 to present). GPM provides more accurate measurements than TRMM, improved detection of light rain and snow, and extended spatial coverage.
TRMM and GPM products are available individually or have been integrated with an international constellation of satellites to yield improved spatial/temporal precipitation estimates and provide a temporal resolution of 30 minutes. TRMM data have been integrated into the TRMM Multi-satellite Precipitation Analysis (TMPA) while GPM data are part of the Integrated Multi-satellitE Retrievals for GPM (IMERG). IMERG's multiple runs accommodate different user requirements for latency and accuracy (Early = 4 hours for flash flood events, Late = 12 hours for crop forecasting, and Final = 3 months for research with the incorporation of rain gauge data).
NASA also maintains mathematical precipitation models that incorporate satellite information with ground-based data when available. These models are part of the Land Data Assimilation System (LDAS), which includes a global collection (GLDAS) and a North American collection (NLDAS). LDAS takes inputs of measurements like precipitation, soil texture, topography, and leaf area index and uses these inputs to model output estimates. In addition to IMERG and LDAS, the Advanced Microwave Scatter Radiometer-2 (AMSR2) aboard the JAXA Global Change Observation Mission 1st-Water, "SHIZUKU" (GCOM-W1) satellite collects data that indicate the rate at which precipitation is falling on the surface of the ocean.
Near real-time data can be accessed from Worldview:
- IMERG Precipitation Rate
- AMSR2 Precipitation Rate
- NLDAS Precipitation Total
- GLDAS Total Monthly Precipitation Rate
Data products can be visualized as a time-averaged map, an animation, seasonal maps, scatter plots, or a time series through an online interactive tool called Giovanni. Follow these steps to plot data in Giovanni: 1) Select a map plot type. 2) Select a date range. Data are in multiple temporal resolutions, so be sure to note the start and end date to ensure you access the desired dataset. 3) Check the box of the variable in the left column that you would like to include and then plot the data. For more information on choosing a type of plot, see the Giovanni User Manual. Note: An Earthdata Login is required to use Giovanni.
Research quality data products can be accessed using Earthdata Search (Note: An Earthdata Login is required to download data from Earthdata Search):
Daymet is a collection of gridded estimates of daily weather parameters. It is modeled on daily meteorological observations. Weather parameters in Daymet include daily minimum and maximum temperature, precipitation, vapor pressure, radiation, snow water equivalent, and day length at 1 km resolution over North America, Puerto Rico, and Hawaii.
Daymet data can be retrieved in a variety of ways, including: Earthdata Search; an Oak Ridge National Laboratory DAAC (ORNL DAAC) API; ORNL DAAC tools; and through the Land Processes DAAC (LP DAAC) Application for Extracting and Exploring Analysis Ready Samples (AppEEARS).
Global geospatial datasets related to drought monitoring are available on the Early Warning eXplorer (EWX): Next Generation Viewer. A guide produced by the Climate Hazards Center, University of California Santa Barbara, provides tutorials for using this tool.
Land surface temperature (LST) is used as a measurement of vegetative stress, with higher LST values being indicative of more stressed vegetation. Since temperature is a main controller of fuel moisture content, areas with higher LST values may have lower fuel moisture. Dry fuel, such as vegetation with low moisture values in areas with high LST, plays a large factor in fire ignition, spread, and other fire behavior.
LST data can be visualized in Worldview:
Research quality land surface temperature data products can be accessed directly using Earthdata Search (these data also are available for download through LP DAAC's Data Pool). MODIS and ASTER data are available as HDF and VIIRS and data from NASA's Ecosystem Spaceborne Thermal Radiometer Experiment on Space Station (ECOSTRESS) are available as HDF5 (Note: An Earthdata Login is required to download data from Earthdata Search and LP DAAC):
- Terra MODIS Land Surface Temperature
- Aqua MODIS Land Surface Temperature
For both MODIS products, select daily, 8-day, or monthly at 1 km or 5.6 km resolution. - Terra MODIS Land Surface Temperature/3-Band Emissivity
- Aqua MODIS Land Surface Temperature/3-Band Emissivity
For both MODIS products, select 5-min, daily, and 8-day at 1 km resolution. - VIIRS Land Surface Temperature
- VIIRS Land Surface Temperature/3-Band Emissivity
Choose daily or 8-day at 1 km resolution. - ASTER Surface Kinetic Temperature
ASTER Surface Temperature products are processed on-demand and must be requested with additional parameters. Note that there is a limit to 2,000 granules per order. - ECOSTRESS Land Surface Temperature
To quickly extract a subset of ECOSTRESS, MODIS, or VIIRS data for your region of interest, use AppEEARS at NASA's LP DAAC or subsetting tools at NASA's ORNL DAAC.
Landsat data can be discovered using Earthdata Search; however, you will need a USGS Earth Explorer login to download data.
- Landsat 8 Thermal Infrared Sensor
Measures land surface temperature in two thermal bands with a new technology that utilizes quantum physics to detect heat.
Soil moisture is important in forecasting fire events as the dryness of the soil contributes to fire potential. Satellite data can provide a global view of soil moisture. Although ground- based measurements provide data at a higher resolution, these data are often sparse and have limited coverage. The preferred measurement (satellite vs. ground-based) should be chosen based upon your needs..
NASA’s Soil Moisture Active Passive (SMAP) satellite acquires global measurements of the moisture in the top 5 cm of the soil every three days at a resolution of 10-40 km. In addition to SMAP, the AMSR2 instrument aboard the GCOM-W1 satellite provides a daily measurement of surface soil moisture NRT product. SMAP and AMSR2 imagery can be accessed using NASA Worldview:
NASA maintains models of soil moisture content, which incorporate satellite information with ground-based data when available. These models are part of the Land Data Assimilation System (LDAS). The Famine Early Warning Systems Network (FEWS NET) LDAS (FLDAS) datasets offer global monthly data with a 0.1º x 0.1º spatial resolution covering the period from January 1982 to present. FLDAS Soil Moisture data are available from the surface to the depth of 10 cm and 100 cm and re-expressed as volumetric water content percent.
FLDAS datasets also are available on the Early Warning eXplorer (EWX): Next Generation Viewer. A guide produced by the Climate Hazards Center, University of California Santa Barbara, provides tutorials for using this tool.
The Soil Moisture Visualizer available at NASA's ORNL DAAC integrates ground-based, SMAP, and other soil moisture data into a visualization and data distribution tool.
Data products can be visualized as a time-averaged map, an animation, seasonal maps, scatter plots, or a time series through an online interactive tool called Giovanni. Follow these steps to plot data in Giovanni: 1) Select a map plot type. 2) Select a date range. Data are in multiple temporal resolutions, so be sure to note the start and end date to ensure you access the desired dataset. 3) Check the box of the variable in the left column that you would like to include and then plot the data. For more information on choosing a type of plot, see the Giovanni User Manual. Note: An Earthdata Login is required to use Giovanni.
Research quality data products can be accessed via Earthdata Search:
AppEEARS, available through NASA's LP DAAC, offers another option to simply and efficiently extract subsets, transform, and visualize SMAP data products.
Detailed topography data and imagery help fire managers and emergency management professionals anticipate areas of risk to themselves and assess the impacts of topography on fire behavior, such as topographic influences on wind direction, landslide potential, or runoff.
Digital elevation models from the Shuttle Radar Topography Mission (SRTM) provide high definition maps of all land between 60º north and 56º south latitude, which covers about 80% of Earth's landmass. The spatial resolution is 30 m in the horizontal plane. The ASTER Global Digital Elevation Model (GDEM) coverage spans from 83º north to 83º south latitude, encompassing 99% of Earth's landmass. The spatial resolution is 30 m in the horizontal plane.
On average, compared to geodetic points over the U.S., SRTM data have a lower root mean square error (RMSE); RMSE is a commonly used method to express vertical accuracy of elevation datasets. Digital elevation model data accuracy is typically very sensitive to vegetation cover. ASTER tends to perform better over certain landcover types.
In February 2020, NASA's LP DAAC released a new data product: NASADEM. NASADEM is available at 1 arc-second resolution and extends the legacy of the SRTM by improving the DEM height accuracy and data coverage as well as providing additional SRTM radar-related data products. These improvements were achieved by reprocessing the original SRTM radar signal data and telemetry data with updated algorithms and auxiliary data not available at the time of the original SRTM processing.
There are several ways to access SRTM, GDEM, and NASADEM data:
- SRTM and ASTER DEMs in Worldview
- SRTM from Earthdata Search
These data were acquired in 2000 and are in HGT format, which can be opened in most Geographic Information Systems (GIS), such as ArcGIS or QGIS. Data are also customizable to GeoTIFF. - ASTER GDEM from Earthdata Search
Version 3, released August 2019, has a decrease in elevation void area as well as a decrease in water area anomaly data. For more information on the new release, read this LP DAAC news release. - NASADEM from Earthdata Search
- AppEEARS offers a simple and efficient way to access SRTM and ASTER data.
Wind is a critical fire element, especially as it affects fire behavior. Knowledge of prevailing wind direction is key information for managing a fire response. In addition, the temperature differences inside and outside a fire perimeter create differences in pressure, which can lead to dangerous wind shifts.
The Modern-Era Retrospective analysis for Research and Applications, Version 2 (MERRA-2) is the latest atmospheric reanalysis of the modern satellite era produced by NASA’s Global Modeling and Assimilation Office (GMAO). MERRA-2 assimilates observation types not available to its predecessor, MERRA, and includes updates to the Goddard Earth Observing System (GEOS) model and analysis scheme to provide an ongoing climate analysis. Surface wind data are available through MERRA-2 beginning in 1980 and running a few weeks behind real time.
MERRA-2 monthly surface wind speed imagery and data can be accessed using NASA Worldview:
Data products can be visualized as a time-averaged map, an animation, seasonal maps, scatter plots, or a time series through an online interactive tool called Giovanni. Follow these steps to plot data in Giovanni: 1) Select a map plot type. 2) Select a date range. Data are in multiple temporal resolutions, so be sure to note the start and end date to ensure you access the desired dataset. 3) Check the box of the variable in the left column that you would like to include and then plot the data. For more information on choosing a type of plot, see the Giovanni User Manual. Note: An Earthdata Login is required to use Giovanni.
MERRA-2 data products can be accessed using Earthdata Search:
- MERRA-2 Eastern and Northward Winds
Wind values are in meters per second; the file is available in NetCDF format, and can be opened using the NASA Panoply data viewer.
NASA's Goddard Earth Observing System, Version 5 (GEOS-5) is an atmospheric model used to study the physics of the atmosphere in both the short term, weather, and mid to long term, climate. GEOS-5 has a series of weather maps that can be used to predict parameters such as wind speed up to 240 hours out, which can be used to forecast the movement of a smoke plume over time.
- GEOS-5 Weather Maps
Within the viewer, select the parameter or field of interest, the area of interest, and indicate the forecast time and the forecast lead hour. Selecting "Animate" shows the forecast for the given parameter over the time period indicated. Note that it may take time to load the images to animate. For wind speed near the surface, select 850 as your level (850 hPa is approximately 5,000 ft/1,500 m above sea level).
The regional impacts of wildfires include burned areas as well as changes in runoff patterns and landslide potential. While some areas allow for ground-based measurements of these post-fire impacts, remote locations or locations with rugged terrain can make ground-based measurements impractical. Remote sensing data provide a means to extend our knowledge in these areas.
Burned areas are characterized by deposits of charcoal and ash, removal of vegetation, and alteration of the vegetation structure. The MODIS burned area mapping algorithm takes advantage of these spectral, temporal, and structural changes. It detects the approximate date of burning at a spatial resolution of 500 m by locating the occurrence of rapid changes in daily surface reflectance time series data. The algorithm maps the spatial extent of recent fires and not of fires that occurred in previous seasons or years.
- Burned Area Data from FIRMS
Select the burned area and your month of interest (see image at right). Note: The app can take a few seconds to load. -
Terra/MODIS Corrected Reflectance (Bands 7-2-1) image of the Camp Fire in California north of Sacramento acquired November 8, 2018. Healthy vegetation is green; water is black; ice is turquoise; the active fire is red with blue/green smoke moving to the southwest. Credit: NASA Worldview.
This MODIS band combination is most useful for distinguishing burn scars from naturally low vegetation. When bare soil becomes exposed, the brightness in Band 1 may increase, but that may be offset by the presence of black carbon residue; the near infrared (Band 2) will become darker, and Band 7 becomes more reflective. When assigned to red in the image, Band 7 will show burn scars as deep or bright red, depending on the type of vegetation burned, the amount of residue, or the completeness of the burn. - VIIRS Corrected Reflectance Bands M11-I2-I1 in Worldview
This combination is most useful for distinguishing burn scars from naturally low vegetation or bare soil. Burned areas or fire-affected areas are characterized by deposits of charcoal and ash, removal of vegetation and/or the alteration of vegetation structure. When bare soil becomes exposed, the brightness in Band I1 may increase, but that may be offset by the presence of black carbon residue; the near infrared (Band I2) will become darker, and Band M11 becomes more reflective. When assigned to red in the image, Band M11 will show burn scars as deep or bright red, depending on the type of vegetation burned, the amount of residue, or the completeness of the burn. - Burned Area Data from Earthdata Search
The Terra and Aqua combined Burned Area data product (MCD64A1) is a monthly, global, gridded 500 m product containing per-pixel burned-area and quality information. - MODIS Land Surface Reflectance from Earthdata Search
The MODIS Land Surface Reflectance product is available from both the Terra (MOD09) and Aqua (MYD09) satellites. The sensor resolution is 500 m, imagery resolution is 500 m, and the temporal resolution is daily.green. Using specific band combinations (such as 7-2-1 for wildfires) enables environmental boundaries to be more easily identified. - VIIRS Land Surface Reflectance from Earthdata Search
Burn severity is a quantitative measure of the effects of a fire on the environment that generally considers damage to vegetation and the impact of the burn to the soil. Fire severity is described along a spectrum, ranging from unburned/low severity, to moderate severity, and high severity. Fire intensity, on the other hand, is a measure of the amount of energy released by organic matter as it burns (see illustration to right).
Satellite imagery acquired by MODIS or by instruments aboard the joint NASA/USGS Landsat series of satellites enable pre- and post-fire comparisons and a change detection approach. One of the most effective ways to discriminate is by generating a normalized burn ratio (NBR). The NBR is an index designed to highlight burnt areas in large fire zones, and combines the use of both near infrared (NIR) and shortwave infrared (SWIR) wavelengths. Healthy vegetation shows a very high reflectance in the NIR, and low reflectance in the SWIR; recently burned areas have low reflectance in the NIR and high reflectance in the SWIR. To calculate NBR using Landsat data, see the NASA Applied Sciences Remote Sensing Training on Introduction to Remote Sensing for Wildfire Applications.
- MODIS Surface Reflectance Data from Earthdata Search
- Landsat 8 data from USGS Earth Explorer (Note: A USGS Earth Explorer Login is required to download data.)
The Normalized Difference Vegetation Index (NDVI) is calculated from the visible and near-infrared light reflected by vegetation. Healthy vegetation absorbs visible light and reflects a large portion of near-infrared light. Unhealthy or sparse vegetation, on the other hand, reflects more visible light and less near-infrared light. Very low values of NDVI (0.1 and below) correspond to barren areas of rock, sand, or snow. Moderate values represent shrub and grassland (0.2 to 0.3), while high values indicate temperate and tropical rainforests (0.6 to 0.8).
NDVI data are acquired by the MODIS and VIIRS instruments and can be calculated from data acquired by the Multi-angle Imaging Spectroradiometer (MISR) instrument aboard the Terra satellite. Other NDVI imagery is available through NASA's Web-Enabled Landsat Data (WELD) project. This imagery is created from a composite of images from all available Landsat 4 and 5 Thematic Mapper (TM) and Landsat 7 Enhanced Thematic Mapper Plus (ETM+) Collection 1 data acquired between 2005 and 2012.
Research quality MODIS and VIIRS NDVI data products can be accessed using Earthdata Search; datasets are available as HDF files which can be opened using NASA's Panoply data viewer:
Data products can be visualized as a time-averaged map, an animation, seasonal maps, scatter plots, or a time series through an online interactive tool called Giovanni. Follow these steps to plot data in Giovanni: 1) Select a map plot type. 2) Select a date range. Data are in multiple temporal resolutions, so be sure to note the start and end date to ensure you access the desired dataset. 3) Check the box of the variable in the left column that you would like to include and then plot the data. For more information on choosing a type of plot, see the Giovanni User Manual. Note: An Earthdata Login is required to use Giovanni.
- MODIS NDVI
Data can be downloaded as GeoTIFF.
NDVI imagery can be accessed using NASA Worldview:
Wildfires can remove significant amounts of vegetation, which can impact runoff or change runoff patterns in the burned area. This, in turn, can lead to changes in drainage, replacement of historical plant species through invasive species establishing themselves in a burned area, and an increase in landslide potential through the removal of vegetation to hold soil in place. Remotely sensed precipitation data are a valuable resource for keeping track of the amount of precipitation and its intensity after a burn.
Data from NASA’s Precipitation Measurement Missions (PMM) span more than 20 years, and include data from the joint NASA/Japan Aerospace Exploration Agency (JAXA) Tropical Rainfall Measuring Mission (TRMM; operational 1997 to 2015) and Global Precipitation Mission (GPM; operational 2014 to present). GPM provides more accurate measurements than TRMM, improved detection of light rain and snow, and extended spatial coverage.
TRMM and GPM products are available individually or have been integrated with an international constellation of satellites to yield improved spatial/temporal precipitation estimates and provide a temporal resolution of 30 minutes. TRMM data have been integrated into the TRMM Multi-satellite Precipitation Analysis (TMPA) while GPM data are part of the Integrated Multi-satellitE Retrievals for GPM (IMERG). IMERG's multiple runs accommodate different user requirements for latency and accuracy (Early = 4 hours for flash flood events, Late = 12 hours for crop forecasting, and Final = 3 months for research with the incorporation of rain gauge data).
NASA also maintains mathematical precipitation models that incorporate satellite information with ground-based data when available. These models are part of the Land Data Assimilation System (LDAS), which includes a global collection (GLDAS) and a North American collection (NLDAS). LDAS takes inputs of measurements like precipitation, soil texture, topography, and leaf area index and uses these inputs to model output estimates. In addition to IMERG and LDAS, the Advanced Microwave Scatter Radiometer-2 (AMSR2) aboard the JAXA Global Change Observation Mission 1st-Water, "SHIZUKU" (GCOM-W1) satellite collects data that indicate the rate at which precipitation is falling on the surface of the ocean.
Near real-time data can be accessed from Worldview:
- IMERG Precipitation Rate
- AMSR2 Precipitation Rate
- NLDAS Precipitation Total
- GLDAS Precipitation Total
Data products can be visualized as a time-averaged map, an animation, seasonal maps, scatter plots, or a time series through an online interactive tool called Giovanni. Follow these steps to plot data in Giovanni: 1) Select a map plot type. 2) Select a date range. Data are in multiple temporal resolutions, so be sure to note the start and end date to ensure you access the desired dataset. 3) Check the box of the variable in the left column that you would like to include and then plot the data. For more information on choosing a type of plot, see the Giovanni User Manual. Note: An Earthdata Login is required to use Giovanni.
Research quality data products can be accessed using Earthdata Search:
Daymet is a collection of gridded estimates of daily weather parameters. It is modeled on daily meteorological observations. Weather parameters in Daymet include daily minimum and maximum temperature, precipitation, vapor pressure, radiation, snow water equivalent, and day length at 1 km resolution over North America, Puerto Rico, and Hawaii.
Daymet data can be retrieved in a variety of ways, including: Earthdata Search; an ORNL DAAC API; ORNL DAAC tools; and through the LP DAAC Application for Extracting and Exploring Analysis Ready Samples (AppEEARS).
Post-burn topographic impacts include increases in landslide potential, changes in the amount and intensity of runoff from areas with denuded vegetation, and changes in the direct and impact of wind as large trees are burned and removed from an area. Knowing the topography of an area helps fire managers and emergency management professionals anticipate areas of risk.
Digital elevation models from the Shuttle Radar Topography Mission (SRTM) provide high definition maps of all land between 60º north and 56º south latitude, which covers about 80% of Earth's landmass. The spatial resolution is 30 m in the horizontal plane. The ASTER Global Digital Elevation Model (GDEM) coverage spans from 83º north to 83º south latitude, encompassing 99% of Earth's landmass. The spatial resolution is 30 m in the horizontal plane.
On average, compared to geodetic points over the U.S., SRTM data have a lower root mean square error (RMSE); RMSE is a commonly used method to express vertical accuracy of elevation datasets. Digital elevation model data accuracy is typically very sensitive to vegetation cover. ASTER tends to perform better over certain landcover types.
In February 2020, NASA's LP DAAC released a new data product: NASADEM. NASADEM is available at 1 arc-second resolution and extends the legacy of the SRTM by improving the DEM height accuracy and data coverage as well as providing additional SRTM radar-related data products. These improvements were achieved by reprocessing the original SRTM radar signal data and telemetry data with updated algorithms and auxiliary data not available at the time of the original SRTM processing.
There are several ways to access SRTM, GDEM, and NASADEM data:
- SRTM and ASTER DEMs in Worldview
- SRTM from Earthdata Search
These data were acquired in 2000 and are in HGT format, which can be opened in most Geographic Information Systems (GIS), such as ArcGIS or QGIS. Data are also customizable to GeoTIFF. - ASTER GDEM from Earthdata Search
Version 3, released in August 2019, has a decrease in elevation void area as well as a decrease in water area anomaly data. For more information on the new release, read this LP DAAC news release. - AppEEARS offers a simple and efficient way to access SRTM and ASTER data.
- NASADEM from Earthdata Search