A Kink in the Jet Stream

Extreme weather events thousands of miles apart may be linked.
author-share

In northern Pakistan, a hot, western wind blows through the land on summer afternoons. It dries ponds, wilts plants, and sends people and their pets scurrying indoors. The locals are used to it, and pass the time cooling off with lassis and refreshing sherbets made of rose or phalsa flowers.

At the tail end of one such summer in July 2010, dark, heavy clouds brought monsoon rains to northwestern Pakistan and a welcome relief from the heat. But these were not the light rains that people were used to. Unexpected waves of torrential rain came one after another, day after day, becoming a nightmarish two months of almost nonstop rains. By mid-August, the rains had plunged a fifth of Pakistan underwater, killed 1,600 people, and destroyed 1.7 million homes.

Image
Flooding in Pakistan forced millions of spiders up into the trees.
A girl stands next to a tree covered in webs in a heavily flooded area in Sindh, Pakistan. Millions of spiders have climbed into the trees to escape the flood waters. (Photograph by R. Watkins courtesy Department for International Development)

The magnitude of the rainstorms and the scale of destruction they had caused baffled William K. M. Lau, an atmospheric scientist at NASA's Goddard Space Flight Center. “Northwestern Pakistan doesn’t normally get those kinds of storms,” he said. Intrigued by what could have caused the anomalously heavy rains, Lau pored through rain gauge records and remote sensing data for Pakistan. What he stumbled on gave him important clues in understanding not just the extreme rains and floods in Pakistan but also the worst ever heat wave happening thousands of miles away in western Russia.

Monsoon shift

Northern Pakistan is an arid region and does not get a lot of rain even during the monsoon season. It sits in the rain shadow of the Hindu Kush Mountains and is barely touched by the Southwest Monsoon that sweeps through the Indian Subcontinent from June through September. Rain gauge data show that northern Pakistan only gets 160 to 180 millimeters (6 to 7 inches) of total average rainfall at the peak of the monsoon period, a puny amount compared to the 1,600 to 2,000 millimeters (63 to 79 inches) that pours on the Bay of Bengal in India. “The Bay of Bengal usually bears the brunt of the rainfall during that time of the year,” Lau said.

Which is why the country was caught off guard by the heavy rains in 2010. On July 4, torrential rains poured over the northwestern provinces of Khyber Pakhtunkhwa, Sindh, Punjab, and Balochistan. The rains tapered off a few days later, only to pound the provinces with three-day bouts of heavy rain three more times that month. By July 29 the Indus River, which runs the length of Pakistan from India in the north all the way to the Arabian Sea in the south, had overflowed. It burst dams, wrecked bridges and roads, and flooded heavily populated areas. The rains continued to fall through August 8 and by that time, the United Nations stepped in to help with emergency relief efforts.

“To have a fifth of the country flooded like that is very rare,” Lau said. He looked at twelve years of average rainfall data from NASA's Tropical Rainfall Measuring Mission (TRMM) and found that the magnitude of the 2010 rains far exceeded the historical range of weather variability—it was out of the ordinary and not just a particularly bad monsoon season. Lau looked at more TRMM data, focusing on rainfall anomaly for Pakistan and the larger South Asian area, and saw that the entire South Asian Monsoon system had shifted to the northeast. Normally concentrated over the Bay of Bengal, heavy monsoon rains skipped the bay and instead moved north to pour over Pakistan and northeastern India. Intense rain also poured over the northeastern Arabian Sea. What had caused the monsoon to shift and disperse like that?

Image
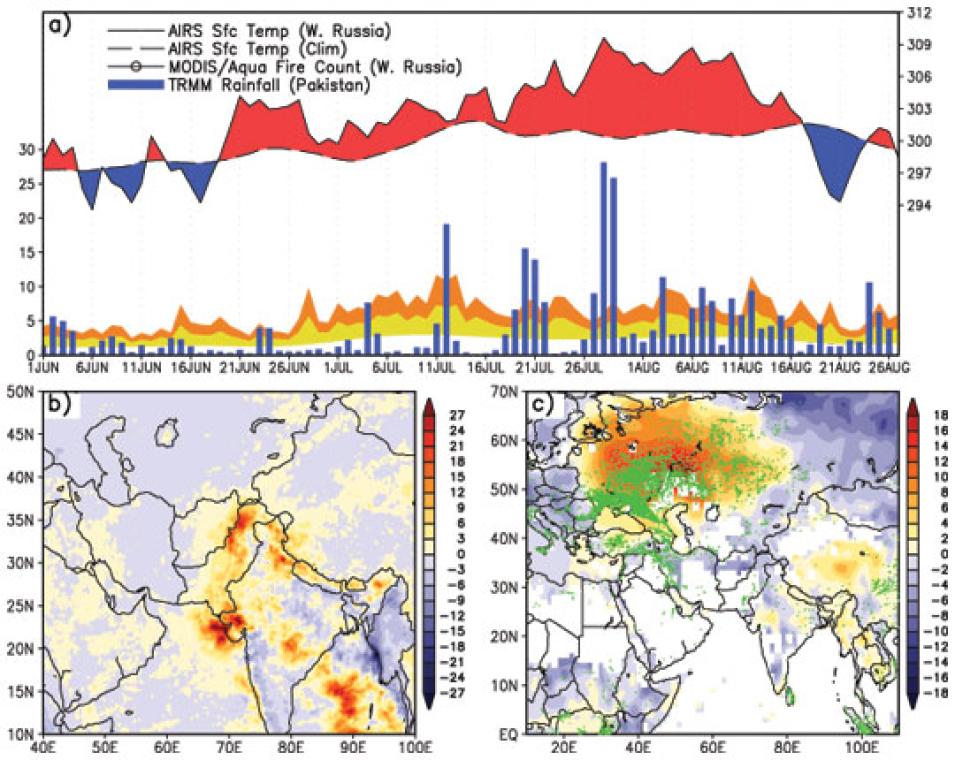
Data image showing meteorological conditions over Russia and Pakistan in 2010
These images show conditions over Russia and Pakistan during the Russian fires and Pakistan flooding in 2010. Image (a) shows a time series of daily surface temperatures averaged over western Russia, from the NASA Atmospheric Infrared Sounder (AIRS). Red indicates higher than average temperatures, and blue indicates lower than average temperatures. The blue bars also show daily rainfall over northern Pakistan for June 1 to August 26, 2010, from the Tropical Rainfall Monitoring Mission (TRMM). The orange and yellow shading shows the two standard deviation range of the TRMM data. Image (b) shows TRMM rainfall anomalies over Pakistan and the South Asian monsoon region for July 25 to August 8. Image (c) shows AIRS surface temperature anomalies, and possible fire locations (green dots) for the same period, from the NASA Moderate Resolution Imaging Spectroradiometer (MODIS). (Courtesy W. K. M. Lau, K. -M. Kim)

A wave impinges

“It was all very strange, so we decided to pick into more data and again look at a much bigger domain,” Lau said. This time he looked at surface temperature data from NASA's Atmospheric Infrared Sounder (AIRS), cloudiness data from NASA's Moderate Resolution Imaging Spectroradiometer (MODIS), and atmospheric pressure, wind, and moisture data from NASA's Modern Era Retrospective Analysis for Research and Applications (MERRA).

Studying an area that extended to Europe and China, Lau found evidence that a series of Rossby waves spanning western Russia and south Asia could have caused the monsoon to shift. Rossby waves are giant meanders in any of the Earth’s jet streams, rivers of wind that circle the globe. Opposing masses of cold polar air sliding south and masses of warm tropical air pushing north can force a jet stream to meander across continents. Areas of low pressure typically develop in the troughs of the waves, while high-pressure areas form in their ridges.

In this case, it was the unusual high-pressure area over western Russia that caused wind patterns to shift the entire South Asian monsoon north and east. It also pulled cold, dry Siberian air over the lower latitudes, which collided with the seasonal warm, moist air arriving over Pakistan from the Bay of Bengal. This was what caused the freakishly heavy rains over northwestern Pakistan.

Lau also saw what had caused the formation of these Rossby waves. The map of atmospheric pressure and wind speeds from NASA MERRA showed a pattern called an atmospheric block hovering over Russia during the last two weeks of the Pakistan rains, an area of high pressure that gets stuck in the jet stream and causes kinks in the normal circulation of wind, temperature, and atmospheric pressure. Atmospheric blocks are natural, but rare; where they form, it gets extremely warm and dry—and downstream of a block, extremely cool or wet.

What hovered over Russia

While the block pushed rains onto Pakistan, under the block, Russia was experiencing its worst heat wave. Record temperatures of up to 100 degrees Fahrenheit and widespread drought caused thousands of peat and forest fires to break out in western and central Russia from late June to early September 2010. The fires caused heavy smog in many urban regions, ravaged 2.3 million acres, and cost the equivalent of 15 billion dollars in damages. About 56,000 people lost their lives from the effects of the heat wave.

Lau said certain interactions between the land and the atmosphere may have intensified Russia’s heat wave and prolonged the atmospheric block. Data from MERRA showed that the initial drought dried the soil, and the lack of moisture slowed the formation of clouds. The 20 percent reduction in cloud cover over western Russia was enough to cause a positive feedback, amplifying the heat wave. This in turn intensified and prolonged the atmospheric block and increased transport of cold, dry Siberian air over the Pakistan region, Lau said.

Image
Photograph of a ground fire near the Moscow Region, Russia
A firefighter attempts to extinguish a ground fire to prevent it from reaching a village near Elektrogorsk, Moscow Region, in August 2010. (Courtesy I. Solovey/strf.ru)

“We never went in thinking that the two events were remotely related,” Lau said. “But when a meteorologist sees a picture like this, an atmospheric blocking, an upper level trough and rainfall over Pakistan, it’s entirely consistent. There’s no question that this atmospheric blocking over Russia was what was causing the rainfall in Pakistan.” Lau said it is probably hard to imagine that the two events could be physically related, just because they are separated by at least 1,500 miles. But scientists have suspected that Rossby waves can cause one weather anomaly to trigger another one thousands of miles away.

“This is the first time that this kind of scenario has ever been proposed,” Lau said. While the evidence looks strong that the block triggered both of these weather extremes, Lau wants to delve into weather models to rule out any other causes. He also wants to find out what might trigger a repeat in the future. Lau is plugging in data on the Russian heat wave and the Pakistan rains into climate models to run different climate change scenarios. He said, “We can find out if such an event has a higher or lower chance of occurring in a warming world.”

Reference

Lau, William K. M., and K. -M. Kim. 2012. The 2010 Pakistan flood and Russian heat wave: Teleconnection of hydrometeorological extremes. Journal of Hydrometeorology, doi:10.1175/JHM-D-11-016.1.

For more information

NASA Fire Information for Resource Management System (FIRMS)

NASA Goddard Earth Sciences Data and Information Services Center (GES DISC)

NASA Level 1 and Atmosphere Archive and Distribution System Distributed Active Archive Center (LAADS DAAC)

Tropical Rainfall Measuring Mission (TRMM)

William K. M. Lau

About the remote sensing data used
Satellite Terra and Aqua Tropical Rainfall Monitoring Mission (TRMM) Aqua
Sensor Moderate Resolution Imaging Spectroradiometer (MODIS) TRMM Microwave Imager Atmospheric Infrared Sounder (AIRS)
Data sets MODIS Cloud Product TRMM Daily Rainfall AIRS IR Geolocated Radiances
Resolution 1 kilometer, 5 kilometer Daily

Horizontal: 1 x 1 deg

Vertical: up to 24 pressure levels

Parameter Cloud fraction Precipitation rate Radiance
DAACs NASA Level 1 and Atmosphere Archive and Distribution System Distributed Active Archive Center (LAADS DAAC) NASA Goddard Earth Sciences Data and Information Services Center (GES DISC) NASA GES DISC

The image in the title graphic shows atmospheric clouds following the jet stream. (Courtesy NASA)

Last Updated