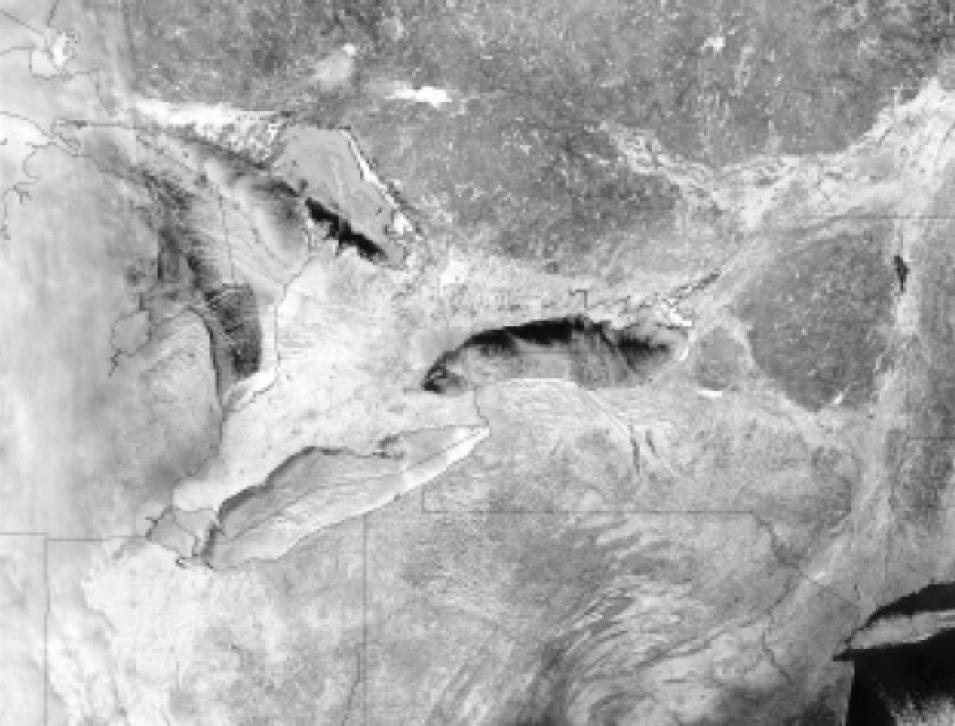
People who live on the islands that dot Lake Erie, one of Michigan’s Great Lakes, have a tradition of visiting each other by driving across the frozen lake’s surface in the wintertime. The islanders do not use regular vehicles, however. They drive cars without doors and roofs, so if the vehicles fall through the ice, the passengers can escape. A few weak spots in the ice are well known because they persist in the same area from year to year, but the overall behavior of ice on the Great Lakes is dynamic and hard to predict.
Understanding Great Lakes ice means enduring some tough conditions. A Web page encouraging tourism to Lake Superior observes that, in the wintertime, lakeshore temperatures rarely fall below negative thirty-five degrees Celsius (negative thirty degrees Fahrenheit). “When you’re trying to collect data, you certainly appreciate why there’s so little data available about ice during the winter,” George Leshkevich said.
Leshkevich is a research physical scientist and the Great Lakes Node Manager for the National Oceanic and Atmospheric Administration’s CoastWatch Program, and he has studied the Great Lakes since 1973. From time to time, he has become painfully familiar with the Great Lakes’ sub-zero temperatures. He and colleague Son Nghiem, principal engineer at the California Institute of Technology at NASA’s Jet Propulsion Laboratory, have traveled across Lake Superior, studying the ice at close range. One thing they have learned about the Great Lakes in the wintertime is that the wind only intensifies the cold. Yet the same wind that makes personal inspection so uncomfortable may hold the key to answering their questions about Great Lakes ice: how much ice will form, how thick it will be, and where it will drift.
Problems with brash ice
Collectively, the Great Lakes cover approximately 244,060 square kilometers (94,230 square miles), and have become a hub of economic activity. In 2000 and 2001, the population for the Great Lakes Basin, including both Canadian and United States residents, was estimated at thirty-four million people. The lakes provide a means of moving iron ore, coal, and grain; and they provide fish, hydropower, and drinking water. Human uses aside, these giant bodies of water affect regional weather. Leshkevich explains that ice cover on the lakes not only affects regional weather, but also hinders the movement of goods and passengers.
Not every kind of ship can pass through every kind of ice cover. For example, especially thick or ridged ice can normally only be crossed with an icebreaker, a ship with a reinforced bow specifically designed to break ice. “The U.S. Coast Guard services the Great Lakes with icebreaking activities. They want to know where the ice is and what type of ice they have to deal with,” Leshkevich said. Providing the answer is not necessarily simple. On a large body of water subject to freezing temperatures, there will be ice somewher.e. But knowing exactly where, when, and how this ice will form and move is hardly straightforward. “Although it’s seasonal—we don’t have second-year ice or multiyear ice—the ice cover on the Great Lakes can be very dynamic,” he said.
Nghiem said, “Winds can push the ice together and create a kind of ice called brash ice.” Formed by broken ice, often with protruding edges, this kind office can accumulate until it is several meters thick, posing a serious challenge for ships trying to pass through it.
Leshkevich said, “Even the U.S. Coast Guard Cutter Mackinaw, which is an Arctic-class icebreaker, can have trouble in brash ice. Sometimes it has to back up and ram several times to get through that ice. So if you’re talking about a lake freighter that doesn’t have those capabilities, the ice can present real problems.” Shipping in the region would be far less complicated if ships could maneuver around such ice, or know when to call on icebreaking ships for assistance. By being able to forecast the location and thickness of Great Lakes ice cover, Leshkevich and Nghiem can help both the businesses using the lakes and the icebreakers servicing the lakes.
Compared to trekking out onto the ice, taking a picture of the ice cover would be easier. Although any kind of aerial view of the region might seem beneficial, not all views are equal. Aerial photographs or satellite images that show the same things that human eyes see, namely what is revealed by light in the visible spectrum, may not be the best choice because clouds can get in the way. Nghiem said, “Cloud cover is persistent over the Great Lakes, especially during the wintertime. When the ice starts to break up, a lot of vapor comes off the lake.” This vapor forms clouds that make imaging the lake ice difficult. Moreover, he added, “At night, it’s very hard for the satellites to ‘see.’” Satellites that rely on visible light can only acquire images during the daytime.
Fortunately, satellite sensors can detect several different kinds of light, including wavelengths invisible to human eyes. Defined as accurate and stable radars, scatterometer sensors operate in the microwave portion of the spectrum. “The advantage of scatterometry is that it can ‘see’ through clouds, and it can cover the Great Lakes area once or twice a day, depending on the orbit of the satellite,” Nghiem said. Unlike some satellites with nighttime passes that do not yield usable data, scatterometers can collect data at night. Even better, they can “see” wind.
The stations are often placed in rural areas with open fields, but can also be installed in cities on building rooftops. Stations are typically networked in arrays, which detect lightning within a radius of 200 to 300 kilometers (124 to 186 miles). Yet storms frequently sweep outside an array’s range, creating gaps in lightning detection. In addition, arrays exist in only a handful of states, plus Canada, Columbia, Spain, and France. The lack of continuous coverage limited what forecasters could learn about lightning and storm development.
Detecting wind with SeaWinds
During World War II, something known at the time as “sea clutter” interfered with radar measurements over the ocean. Only in the 1960s did scientists realize that winds caused this noise in their radar measurements, and that radar could be used to measure wind speed and direction. The Skylab missions of 1973 and 1974 included a newly built scatterometer designed to collect those measurements. In the years that followed, NASA introduced new scatterometers.
Operated by NASA’s Jet Propulsion Laboratory, the SeaWinds scatterometer flies on the NASA Quick Scatterometer (QuikSCAT) mission. The sensor measures wind speed and direction over Earth’s ice-free water surfaces; these data are archived at the NASA Physical Oceanography Distributed Active Archive Center (PO.DAAC).
The SeaWinds sensor works by transmitting a microwave signal toward the water’s surface and measuring the strength of the returned signal. Because winds influence waves, winds roughen the water’s surface. A smooth water surface returns a weak signal, but a rough surface returns a strong signal as the waves scatter more energy back toward the sensor. The SeaWinds sensor also uses a spinning antenna, enabling the measurement of wind direction.
One advantage that SeaWinds has over some other sensors is that it sends and receives data in different polarizations. Polarization is defined as the spatial orientation of electromagnetic waves, and when the spatial orientation is not random, it polarized. Leshkevich said, “Sometimes wind waves—waves caused by wind speed and direction—can duplicate the signal of certain ice types. So if you look at the data, you’re not sure if you’re looking at an ice type or if it’s waves caused by wind.” This problem occurs when satellite sensors operate at one wavelength and in one polarization. Because SeaWinds sends and receives signals in different polarizations, it better distinguishes between rough waves and certain kinds of ice. This is important for the mapping project because it shows the difference between the ice itself and the wind that moves it around. By distinguishing between these two data signals, while also incorporating them into the same product, Leshkevich and Nghiem hope to show exactly how the wind is likely to move the ice.
Acquiring field data on the lakes
To further discern the difference between rough waves and ice detected by scatterometers, Leshkevich and Nghiem have taken a closer look at the Great Lakes. In a recent field experiment, Nghiem built a radar that they mounted on a Coast Guard icebreaker. They matched the radar’s backscatter readings with the physical characteristics of the ice, collecting all the measurements for comparison with calibrated satellite measurements. Nghiem said, “It’s like a library or dictionary so we know what kind of ice would have what kind of radar signature.”
While looking closely at the ice, Nghiem and Leshkevich noticed something else. “What we’ve noticed on Lake Superior during March is that 1997 was probably the last year where you had extensive ice cover of good quality. By ‘good quality,’ I mean the ice is not noticeably decaying, the ice is thick, the ice covers more of the lake,” Nghiem said. “It seems that since 1998, we’ve had below-normal ice cover, with the exception of 2003.”
Leshkevich agreed. “As we went across Lake Superior on the Mackinaw in mid-March 2003, the ice just seemed to be more in a state of decay. Even though the coverage was more extensive that winter, the ice cover wasn’t the same quality. It had water on it and holes in it that were probably caused by water drainage through the ice. It wasn’t as thick and much of it was in a state of decay.”
Are they seeing a trend? They think it is too soon to tell. Nghiem said, “People should not come to a conclusion too quickly to say the Great Lakes won’t be covered by ice anymore. The past decade is a short time period compared to the climate record.”
Future plans
Nghiem and Leshkevich plan to continue to develop and refine products to map ice cover on the Great Lakes. “The limitation of scatterometer data is the resolution,” Nghiem said. “The lower-resolution scatterometer data is twenty-five kilometers, which has a limited application to the Great Lakes. But we do have higher-resolution data that we call ‘slice data.’ It can give you about twelve-kilometer resolution.” Nghiem and Leshkevich use SeaWinds data in conjunction with Synthetic Aperture Radar (SAR) data to “see” through clouds and monitor the Great Lakes ice cover. The SAR data has higher spatial resolution, but the scatterometer data has much better temporal resolution, with two overpasses a day.
Nghiem and Leshkevich hope to develop a process that automatically maps Great Lakes ice cover in real time. Leshkevich said, “This project is ongoing and we still haven’t finished it, but we’re a good ways along in development, and we just need to do a little more testing.” As for results achieved so far, they can point to prototype maps on the NOAA Great Lakes CoastWatch Web site. These maps show Great Lakes ice cover and wind fields derived from QuikSCAT/SeaWinds data. With this information, forecasters may be able to predict where wind might move the ice cover or open leads, or fractures, in the ice.
Leshkevich and Nghiem have considered developing a composite product to show ice cover, open water, and wind direction, or wind vector. “That would give users a sense of not only where the ice cover is and what type it may be, but also, based on the wind vectors, which direction the ice is likely to move,” Leshkevich said. That information would help inform the Coast Guard and companies and commuters who use the Great Lakes during the winter, aiding them in safe winter navigation and more cost-effective ice breaking.
References
Johnson, M. W., and J. Nogues-Paegle. 1996. Description of the tropical intraseasonal oscillation based on NMC Re-Analysis. Presented at the spring meeting of the American Meteorological Society, Atlanta.
People in the Great Lakes region. Great Lakes Information Network. Accessed March 22, 2006.
http://www.great-lakes.net/envt/flora-fauna/people.html
The Great Lakes: An environmental atlas and resource book. U.S. Environmental Protection Agency. Accessed March 22, 2006. http://www.epa.gov/glnpo/atlas/glat-ch3.html
Superior pursuit: Facts about the greatest Great Lake. Minnesota Sea Grant. Accessed March 23, 2006.
http://www.seagrant.umn.edu/tourism/pursuit.html
Winds: Measuring ocean winds from space. Jet Propulsion Laboratory. Accessed March 23, 2006.
http://winds.jpl.nasa.gov/index.cfm
On Great Lakes, winter is served straight up. New York Times. Accessed March 23, 2006. http://www.nytimes.com/2006/02/19/national/19lake.html
For more information
National Oceanic and Atmospheric Administration CoastWatch ice cover maps
NASA Physical Oceanography DAAC (PO.DAAC)
About the remote sensing data used | |||
---|---|---|---|
Satellite | QuikSCAT | ||
Sensors | SeaWinds | ||
Data set used | Backscatter | ||
Resolution | 12.5 kilometers | ||
Parameter | Lake vector wind | ||
DAAC | NASA Physical Oceanography DAAC (PO.DAAC) | ||
Science funding | National Oceanic and Atmospheric Administration (NOAA) |
About the scientists
George Leshkevich is a research physical scientist and Great Lakes Node Manager for the National Oceanic and Atmospheric Administration (NOAA) CoastWatch Program at the Great Lakes Environmental Research Laboratory. His remote sensing research uses optical and radar satellite sensors, as well as field experimentation. His research has involved the analysis of Great Lakes parameters and features, including ice cover, classification and mapping, and ocean color applications. | |
Son V. Nghiem is a principal engineer at the Jet Propulsion Laboratory at the California Institute of Technology. His research covers active and passive remote sensing, field experimentation, electromagnetic wave theory and applications, and scattering and emission modeling. He received the 1999 Lew Allen Award for Excellence for his research in Earth science remote sensing and the 2006 NASA Exceptional Achievement Medal for developing scientific applications for scatterometry. |