On any given day in the United States, an American might wear a shirt sewn in Morocco, drive a car manufactured in Japan, or eat an apple grown in Chile. The global economy thrives on the constant exchange between countries. As more nations become industrialized, however, they are creating an unintended new export: air pollution. For years, scientists have observed belts of air pollution traveling on wind currents, following weather patterns, and crossing oceans and continents. However, determining where air pollution originated is not as easy as reading a clothing tag or a fruit label.
On the Trail of Global Pollution Drift
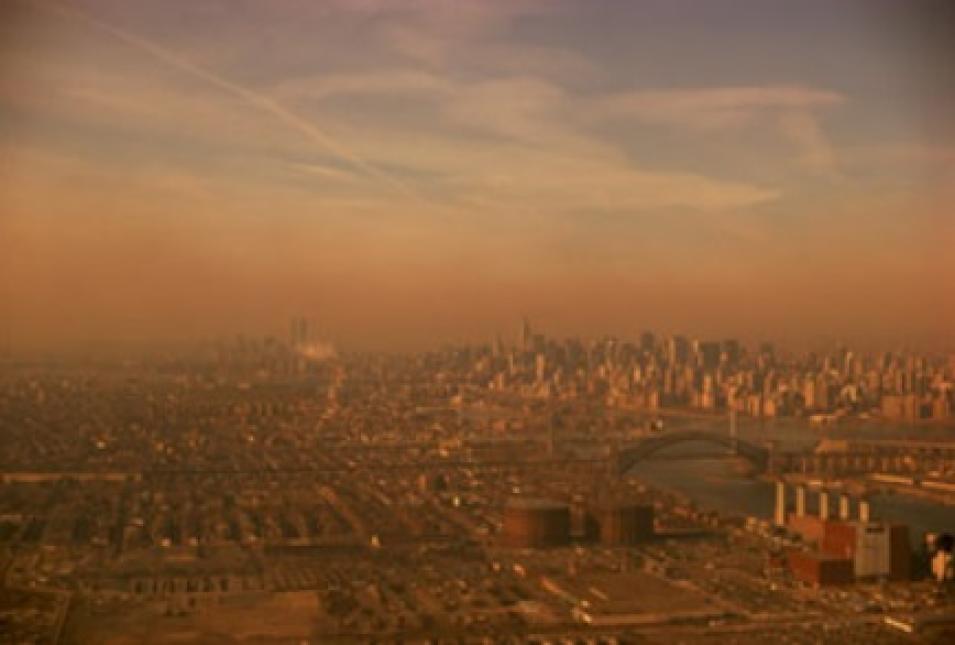
The photograph above shows air pollution in New York City. Exposure to high levels of air pollutants can inflame lung tissue and aggravate asthma, increase susceptibility to respiratory illnesses, and cause other problems for human health. (Image above and in title graphic courtesy Photos.com)
High levels of air pollution affect millions of people each year. Excessive amounts of ozone and carbon monoxide can cause respiratory problems, and ozone can aggravate asthma and lead to the premature aging of lung tissue. Other components of air pollution can cause eye irritation, skin rashes, headaches, and sore throats. Bad air days in Los Angeles and Houston, while occurring less frequently, still lead to increased hospital admissions. And poor air quality in large Asian cities often forces residents to remain indoors, affecting their health and disrupting their ability to travel, work, and attend school. To monitor and improve air quality, organizations such as the United States Environmental Protection Agency (EPA) need to know where that pollution is coming from.
Daniel Jacob, an atmospheric scientist and professor at Harvard University, studies atmospheric chemistry, air quality, and pollution drift. Although he has used a variety of instruments and sensors in his research to accurately study where pollution originates and where it drifts, he needed a global data set that could expose both natural and anthropogenic sources of common air pollutants.
Jacob began analyzing data from a new satellite mission, the Tropospheric Emission Spectrometer (TES) instrument, launched aboard NASA's Aura satellite in July 2004. "We'd seen elevated levels of ozone over the northern midlatitudes before. But with TES data, for the first time we have a way to separate and identify the anthropogenic contributions," Jacob said. By investigating the relationship between ozone and carbon monoxide, Jacob discovered that not only could TES data detect pollution drift patterns, but it could also reveal ozone sources.
Identifying the sources of drifting air pollution can be difficult, because most pollutants are emitted by both natural and human sources. For instance, nitrogen oxides, which contribute to ozone development, are produced by lightning strikes, and wildfires emit carbon monoxide. Both pollutants are also generated by anthropogenic sources such as automobile exhaust and industrial emissions.
And while ozone in the upper atmosphere, called the stratosphere, helps protect the planet by absorbing solar radiation, ozone in the atmosphere closest to Earth's surface, called the troposphere, is a pollutant and can be harmful to people and plant life. Ground-level ozone, the primary component of smog, forms when high temperatures induce chemical reactions between various air pollutants that human activities often generate.
The needle tips of this white pine have turned pale, revealing burns caused by ozone. Overexposure to ozone not only causes discoloration; it can also reduce tree growth. Ozone diminishes a plant's ability to produce and store food, making it vulnerable to disease, pests, and inclement weather. (Photograph by Andrew J. Boone/courtesy forestryimages.org)
The Northern Hemisphere pollution belt
Jacob and his colleagues studied the pollution belt that develops each summer across the Northern Hemisphere midlatitudes between the Arctic Circle and the Tropic of Cancer, an area that includes most of the United States and Canada, northern Mexico, North Africa, Europe, Russia, and China. The scientists noticed a correlation between different atmospheric chemicals. "In addition to measuring ozone with TES data, we're observing carbon monoxide, which allows us to 'tag' the ozone," Jacob said. "If the elevated ozone comes with elevated carbon monoxide, it's coming from pollution."
In the Northern Hemisphere, motor vehicle and industrial emissions are the most common sources of atmospheric carbon monoxide. By associating elevated levels of ozone with increased amounts of carbon monoxide, Jacob could locate anthropogenic pollution sources in North America, Asia, and Europe.
Jacob's findings corresponded with results from NASA's Goddard Earth Observing System Chem (GEOS-Chem) model, which simulates the chemical composition of the atmosphere using meteorological data from NASA's Global Modeling and Assimilation Office. "This northern midlatitude pollution belt appears to be very consistent between the model results and the TES observations," he said. "That gives us confidence in the predictions that we can make for intercontinental transport of ozone pollution."
Air pollution observations are important for air quality agencies that are trying to measure how much pollution is drifting into their countries. "Using the GEOS-Chem model, we've been giving numbers to the EPA, but until we received the TES data, we weren't able to provide a check on those numbers," Jacob said.
Pollution and air quality
To help regulate air quality, the EPA estimates "background levels" for pollutants like ozone and carbon monoxide. These levels reflect the amount of pollution that would exist in the atmosphere naturally, without human contribution, and provide the basis against which scientists can measure anthropogenic levels of these pollutants in the air.
But if a country is trying to reduce air pollution, what happens when pollution from another country drifts in? "Ozone has a pretty long lifetime in the atmosphere, so it gets transported by weather systems," Jacob said. Observations of the Northern Hemisphere pollution belt show that pollution drifts from Asian sources to western North America, and from eastern North American sources to Europe.
In the United States, timing makes a difference, said Jennifer Logan, a senior research fellow at Harvard University and one of Jacob's colleagues. "The effect of Asian emissions is largest in springtime, because that's when the transport most effectively brings Asian emissions to the West Coast of the U.S.," she said. However, this does not usually impact air quality, because ozone levels in the United States are actually higher in summer, when sizzling temperatures fuel the chemical reactions in the atmosphere that create ozone. "Also, quite a lot of these Asian emissions are drifting so high in the troposphere that they're not in the air that we're breathing," she said.
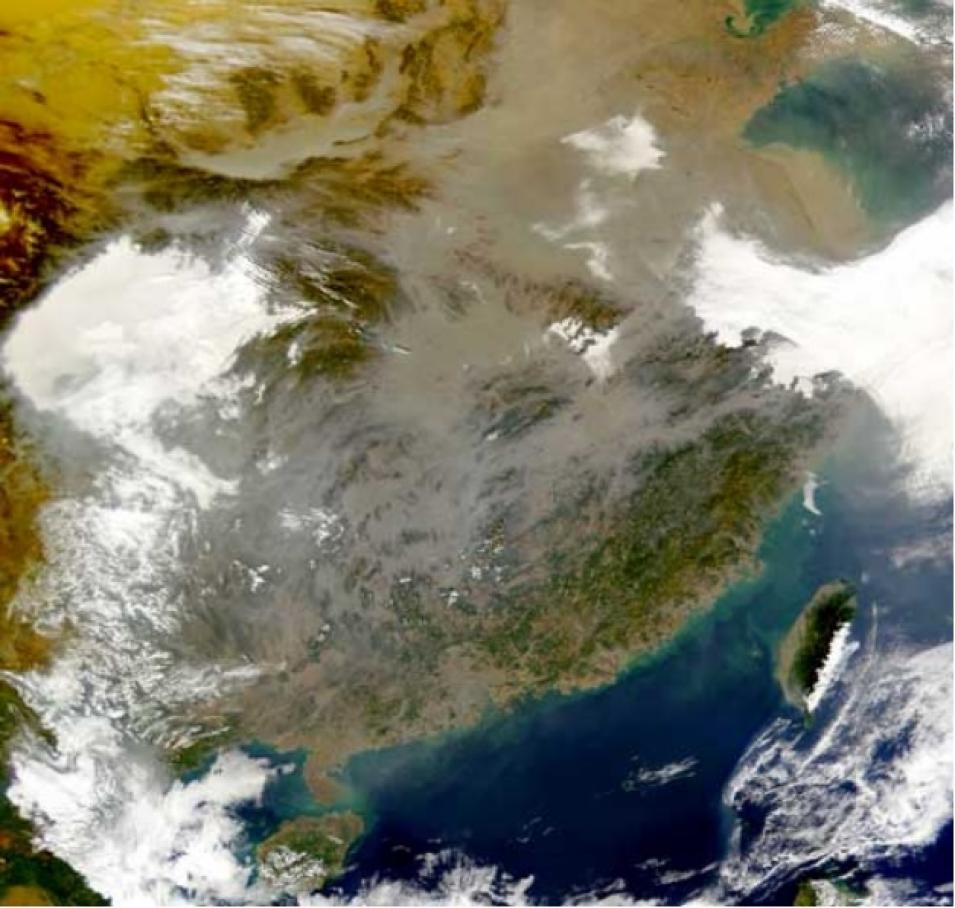
An opaque layer of polluted air covers much of southeastern China, obscuring parts of the landscape. Increasing use of heating fuels like wood and coal contributes to this haze. The image, captured on January 2, 2000, is from the NASA Sea-Viewing Wide Field-of-View Sensor (SeaWiFS). (Courtesy SeaWiFs Project, NASA/Goddard Space Flight Center, and ORBIMAGE)
Logan added that the amount of pollution drifting from Asia to the United States is also relatively small. While Asian air pollution does affect the northwestern United States, it only accounts for a few parts per billion of ozone, Logan said. Considering that the EPA estimates the background level for ozone at forty parts per billion, this means that drifting pollution is not usually the culprit when U.S. cities violate air quality standards.
Even if only occurring in small amounts or at certain times of the year, drifting pollution has the potential to affect people all over the globe. "One thing that people don't like to talk about so much is how much ozone we're sending to Europe," Logan said. "But the Europeans care about that just like we care about how much Asia is sending to us."
Pollution in the Southern Hemisphere
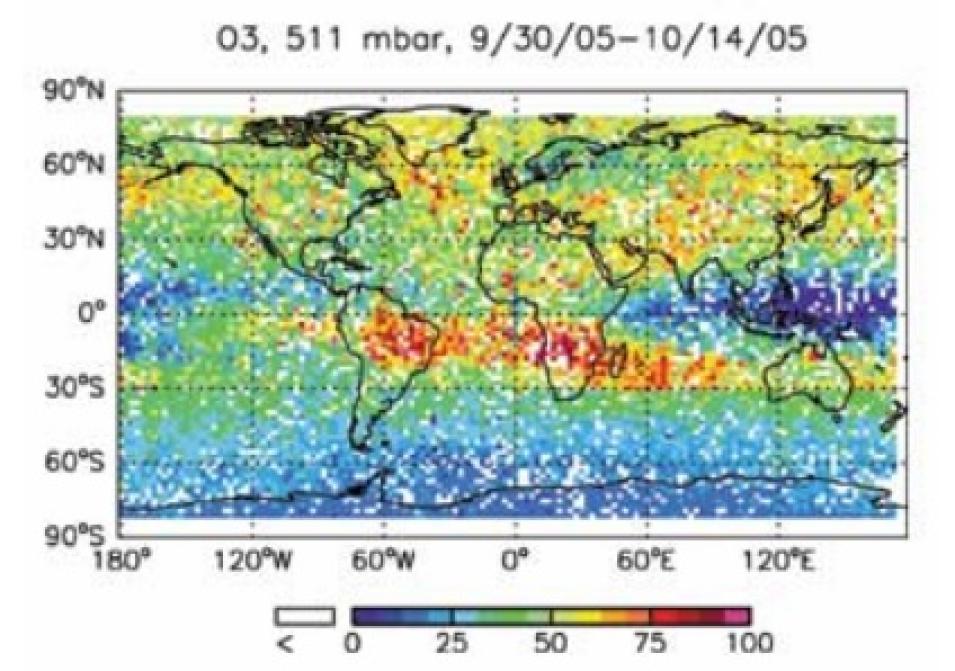
In the Southern Hemisphere, air pollution stems from a different source. "One of the things we see with TES data in the tropics is that ozone is formed by biomass burning," Logan said. "We can see the seasonal evolution of ozone development that seems to parallel the seasonal evolution of biomass burning." Biomass burning produces carbon monoxide and nitrogen oxides, two pollutants that lead to ozone formation.
Tropospheric Emission Spectrometer (TES) data reveal the seasonal progression of elevated ozone in the southern hemisphere. High ozone levels, indicated with warm colors, On the trail of global pollution drift are prominent over Brazil and southern Africa, where farmers frequently burn fields to rejuvenate the soil before the summer growing season. Retrieved ozone mixing ratio is in parts per billion (ppb) at 511 millibars, for the first two weeks of October 2005. White indicates no data, and any values greater than 100 ppb are shown as 100 ppb. (Courtesy Jennifer Logan)
From July through October is the Southern Hemisphere's dry spring season. Farmers across tropical regions burn savanna and forest to clear land and revitalize the soil. The carbon monoxide these fires generate correlates with the increased ozone levels that Logan sees in satellite measurements. "Readings are higher over South America, the south Atlantic, and Africa than they are over the remote Pacific," she said. "That's a planetary-scale feature that we see quite clearly in the TES data. It's great to have a global data set that shows this for the first time."
Piecing together a dynamic picture
And although the first data results from TES are now available from NASA's Atmospheric Science Data Center (ASDC), TES science team members like Jacob and Logan are still validating the instrument's measurements by comparing them to model results, field data, and atmospheric readings from other sources. This process confirms the accuracy of the data and helps researchers improve the data quality. Because TES is a relatively new instrument, science and validation teams are still conducting extensive campaigns.
One of the validation campaigns, the Intercontinental Chemical Transport Experiment (INTEX), is also looking specifically at air pollution drifting into and out of the United States. As industrialization and automobile use increases in developing regions like Asia, researchers want to identify how drifting air pollution will impact U.S. air quality, as well as identify more accurately where U.S. pollution is ending up.
TES data are providing more information about pollution sources, but atmospheric chemistry is dynamic, and scientists are still piecing together what they discover. And although air quality in the United States has improved over the past twenty years, scientists and monitoring agencies are still investigating the global nature of atmospheric transport.
References
Highways of a Global Traveler: Tracking Tropospheric Ozone. NASA Earth Observatory. Accessed March 12, 2006.
Six Common Air Pollutants. U.S. Environmental Protection Agency. Accessed March 11, 2006.
For more information
NASA Atmospheric Science Data Center (ASDC)
Tropospheric Emission Spectrometer (TES)
| About the remote sensing data used | ||
|---|---|---|
| Satellite | Aura | |
| Sensor | Tropospheric Emission Spectrometer (TES) | |
| Data sets | TES Level 2 Global Survey Standard Products | |
| Parameter | Ozone, carbon monoxide | |
| Data product development and analysis | Jet Propulsion Laboratory | |
| DAAC | NASA Atmospheric Science Data Center (ASDC) | |


