Profiles in Intensity

Unmanned aircraft probe the secrets of hurricanes.
author-share

In less than twenty-four hours, Tropical Storm Wilma mushroomed into a Category 5 hurricane. “How the storm was able to do that is still a bit of a mystery,” said Scott Braun, a NASA research meteorologist. “A lot of storms have favorable environments and never undergo that intensification rate. So we’re not quite sure why that storm was so special.” Having one of the fastest intensifications on record, it hit Mexico’s tourism industry, drowned Havana, Cuba, and left six million Floridians without power. The 2005 hurricane became the most intense on record for the Atlantic Basin.

Predicting the track of a storm has improved, but rapid intensification continues to challenge scientists. “Reliably predicting a tropical cyclone’s intensity has become one of the hardest problems in atmospheric sciences,” said Jim Doyle, a scientist at the U.S. Naval Research Laboratory (NRL). He is part of NASA's five-year Hurricane and Severe Storm Sentinel (HS3) mission, using airborne observations to study a storm’s inner-core processes and its surrounding environment—in particular, the Saharan Air Layer (SAL), a very hot, dry, and dusty air mass in the Atlantic Basin.

“We’re interested in how the SAL suppresses or favors storm intensification,” Braun said. Early findings suggest some past explanations of the SAL’s significance have been oversimplified. In addition, information gathered while soaring above 55,000 feet has brought the tops of hurricanes into focus, a side benefit of the mission and one that may shed light on hurricane intensification.

Image
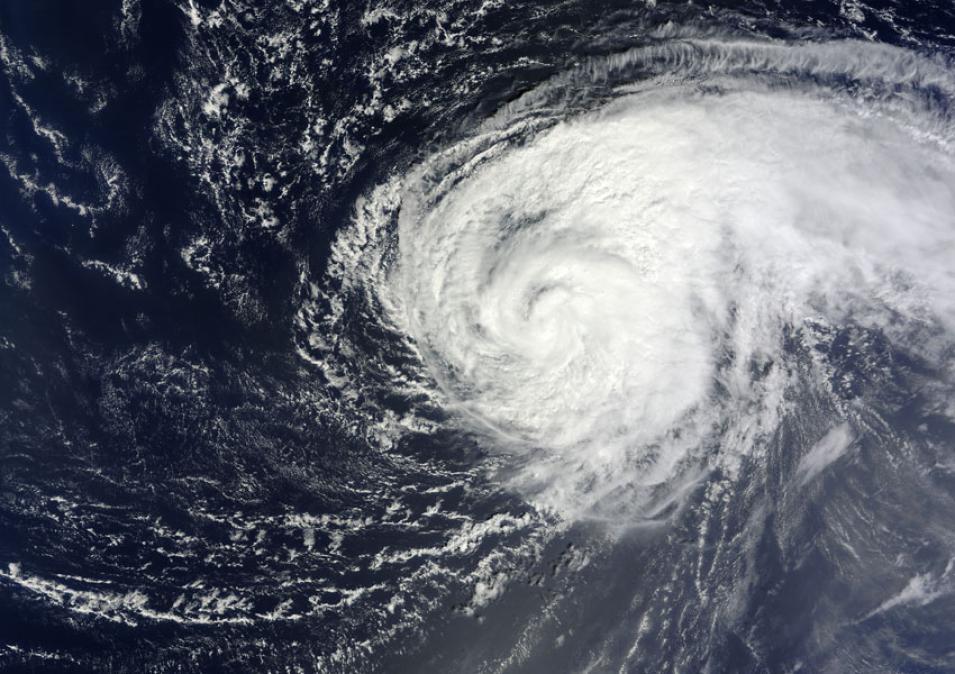
The NASA Terra satellite captured this true-color image of Hurricane Nadine in the Atlantic Ocean on September 16, 2012. (Courtesy Land Atmosphere Near-Real Time Capability for EOS [LANCE] System, NASA GSFC)

The dust within

A sea of sand, the Sahara Desert alternates between barren plateaus and steep, shifting dunes. Strong winds loft dust from the dunes skyward, and then sweep it across the Atlantic basin. Researchers have been studying the Saharan dust for decades, trying to understand its influence in hurricane formation and intensification. “But there’s some debate as to how big of an influence it really is,” Braun said.

Earlier studies argued for and against its influence in hurricane formation. Some suggested it hinders storm development when hot, dry air, like the SAL, funnels into the core. A storm’s ability to intensify relies on cloud formation within the inner core, and clouds need humid air to form. By directly entering the circulation, the SAL evaporates clouds, stopping or slowing formation.

Image
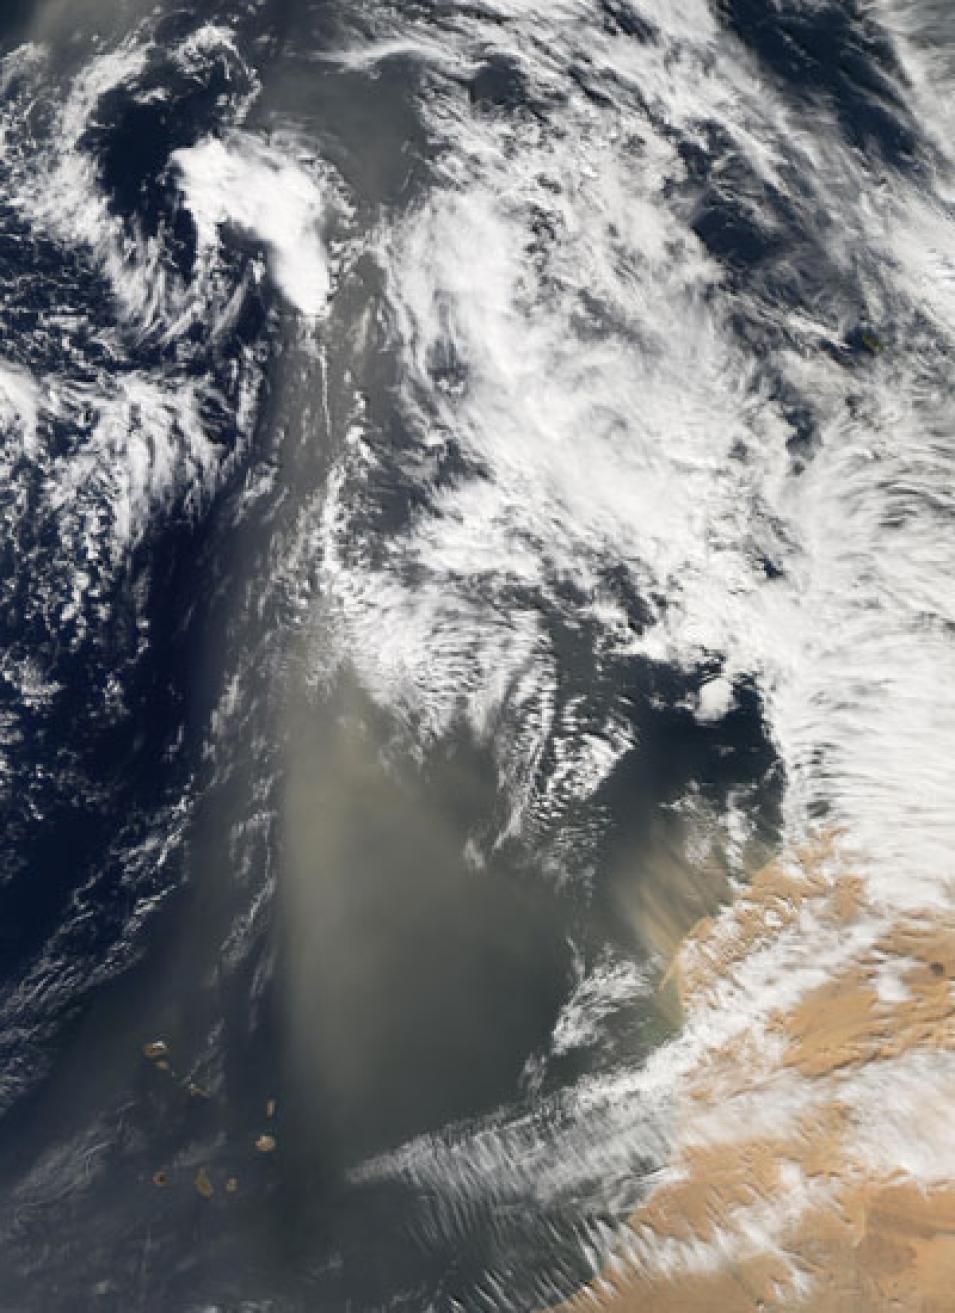
Saharan dust hovers over the Atlantic. The Moderate Resolution Imaging Spectroradiometer on the NASA Aqua satellite captures the dust plumes blowing off Africa's west coast. The clouds may result from the same weather system that initially stirred the dust. A 2007 study suggested a link between large amounts of Saharan dust over the Atlantic in 2006 and less severe hurricanes. (Courtesy Land Atmosphere Near-Real Time Capability for EOS [LANCE] System, NASA GSFC)

But HS3 studies of Hurricane Nadine in 2012 did not quite see that. “Right now our observations don’t support a direct influence in this case, but the SAL suggests an indirect influence, weakening the storm,” Braun said. “It’s sort of able to do it from a distance.” The dust layer absorbs solar radiation, which may cause temperature gradients and shifting wind speeds near and within the storm, impacting its development.

HS3 makes one thing clear: the effect of the SAL is not cut and dried. “We’ve often looked for the easy explanations,” Braun said, “I think we’re getting a better sense at what stage in the lifecycle of a storm the SAL can play a role.” Early on in a storm’s development, the SAL may be more consequential, before the tempest fully forms and is able to protect its inner core with impassable, well-organized walls of wind and rain.

Getting the spins

Hurricanes are monstrous energy machines, converting heat energy garnered from a warm ocean to mechanical energy through convection, or heat transfer. Hurricanes spin two ways. Primary circulation moves in a horizontal direction, while secondary circulation cycles air vertically: in, up, and out. Warming air flows in at the bottom, up through the rain bands and eye wall, and then fans out at the top. As a storm gets more organized, inflow toward the center near the surface increases.

The hope with HS3 is to connect the structure of convection, the upward section in secondary circulation, to the evolving low-level and upper-level wind fields. Much like ice skaters can spin faster by pulling their arms in, winds speeds increase as the low-level air moves toward the center. But air cannot speed up unless clouds pump low-level air out at the top.

That is why Peter Black at NRL approaches intensification from a different angle. “The outflow essentially acts like a vacuum cleaner,” Black said. Forcing air away, the suction drops the storm’s central pressure, and then warm air fills the vacuum. As long as warming air rises up and out faster than new air spirals in, the central pressure in a developing hurricane will fall. And falling pressure is an indicator of hurricane intensity. “Though still a matter of debate,” Braun said, “HS3 provides the best opportunity to date to examine the role of the outflow layer in hurricane intensification.”

Satellites have been mapping hurricanes since the 1970s, but their images of the outflow layer lacked the nitty-gritty details. Getting a sense of the structure of the inner core may be key. Black said, “From our perspective, the HS3 mission is sort of a breakthrough.” Outflow is a side benefit of the mission. Braun, HS3’s principal investigator said, “It never was part of the original proposal, but later we realized the mission could play a significant role in looking at the outflow structure because of the Global Hawk capabilities and its payloads.”

The mission’s unmanned NASA Global Hawk aircraft operate at extreme altitudes up to 63,000 feet, climbing into the stratosphere above a storm. Getting that high is not easy. Most airplanes struggle to burn jet fuel with the low oxygen at that altitude. Flying for up to twenty-six hours and decked with profiling sensors, lasers, cameras and other instruments, the Global Hawks can now see the full extent of the top layer of hurricanes, where outflow happens.

An unexpected profile

For the mission, two Global Hawks soar. One probes the inner core or eyewall region of the storm where the most intense surface winds and rainfall occur. The other Hawk samples the outflow layer by deploying as many as 88 dropsondes, instrumented packages that parachute down through the storm. The result is an image of outflow structure unlike what scientists had imagined.

“Many of us were a bit surprised by the wind profiles we saw in the outflow layer,” Braun said. Dropsondes showed that outflow winds peak at the very top of the layer rather than somewhere within. These winds experience sharp transitions as opposed to more gradual transitions. And overall, the shape of the full outflow layer is much more concentrated, much thinner than satellite data or models had estimated.

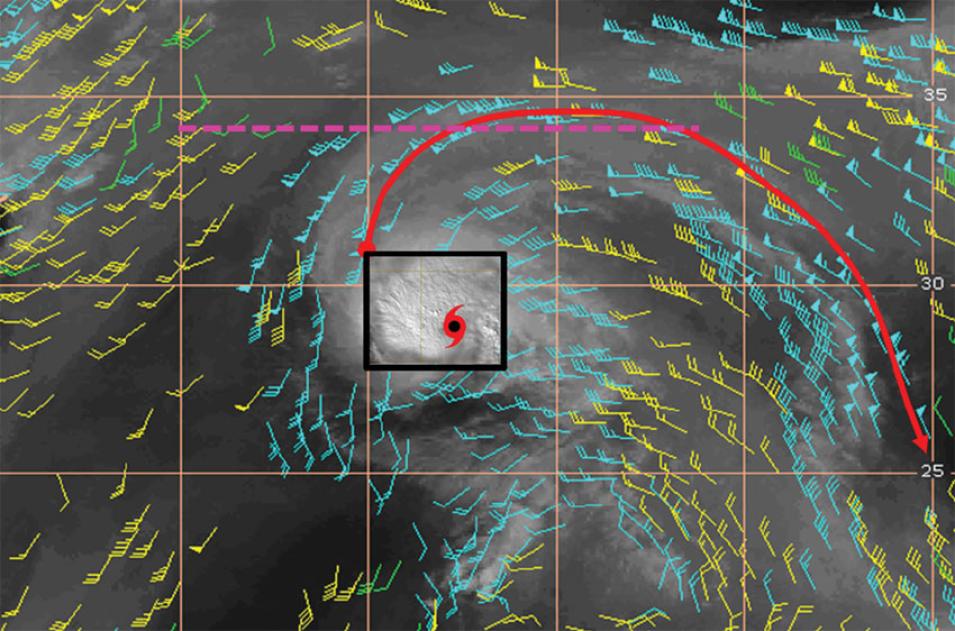
Then there are the outflow jets—roaring channels of humid, high-speed air that surround the top of a hurricane. Sometimes a hurricane only has one channel. Other times, two or more form in different quadrants of the storm. Through these channels most of the air is being evacuated from the storm, but, as the dropsondes show, it is not a uniform process. “Not everything is going out equally in all directions,” Black said. “Something in the environment around the storm focuses the air into high-speed channels.”

Black said, “We had noticed that whenever the tropical storm developed two of these outflow jets, one directed at the equator, one directed towards the pole, it seemed to correspond to a period of rapid intensification.” To help link these events with causes and effects, scientists turned to storm models to reproduce the out-flow structure.
Image
Motion vectors are superimposed on a satellite image of Hurricane Nadine in 2012. A red hurricane symbol marks the center. Strong convection to the northwest gives rise to an outflow jet (solid red curve) that spirals clockwise away from the storm center toward the equator (blue wind vectors), suggesting a dynamic connection between the inner core of the storm and the environment. The dashed magenta line indicates the approximate flight path of the Global Hawk aircraft from the Hurricane and Severe Storm Sentinel mission. Satellite data are from the Moderate Resolution Imaging Spectroradiometer (MODIS) sensor on the NASA Aqua satellite. (Courtesy P. Black/NRL)

Waiting for the big one

Doyle’s team of research meteorologists specializes in tropical cyclone observations and prediction, a vital component of the HS3 mission. In 2012, with Hurricane Nadine, scientists got their first chance to assimilate dropsonde outflow data into their prediction model. HS3 had three successful flights in ten days, each deploying 60 to 75 dropsondes. Doyle’s team ran the prediction model with and without the dropsonde data. “We found the dropsondes were able to help the forecast quite a bit,” Doyle said. “And most importantly, the forecasting model improved substantially.”

But not all storm forecasts respond well to dropsonde data. “So we’re trying to tease out where this impact is coming from,” Doyle said. For now, they have to wait for more storms and more measurements. Meanwhile, NASA's Global Hydrometeorology Resource Center (GHRC) Distributed Active Archive Center (DAAC) is building an archive of data from HS3 for further study.

Still, the mission is not without its challenges. If weather is too harsh at the airfield, the Global Hawks cannot take off. And, of course, hurricanes have to form. The mission missed Hurricane Sandy by a week, and no major hurricanes developed in 2013. “I’m sure people were glad not to deal with hurricanes then, but when you’re doing a field campaign that’s not quite what you want,” Braun said. “We could use some additional cases.” For now, scientists are equipped with the right set of questions. Getting the details right may improve warning systems. And since studies show most people base their evacuation decisions—if and when to leave—on intensity forecasts, answering these questions could better prepare communities for the next big whirlwind.

Image
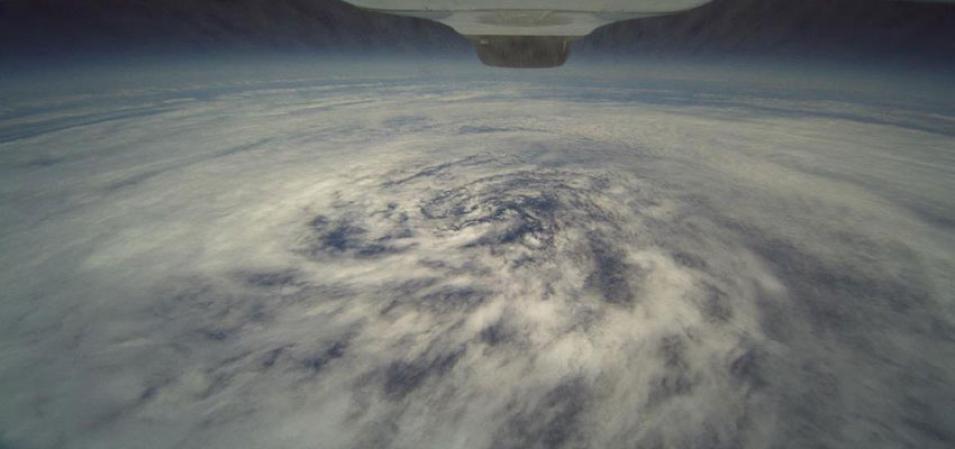
A camera on the underside of the Global Hawk aircraft took this photograph of Tropical Storm Frank from an altitude of 60,000 feet on August 28, 2010. (Courtesy NASA/NOAA)

Reference

NASA’s Hurricane and Severe Storm Sentinel (HS3): Results from the 2012-2013 Deployments

For more information

NASA Global Hydrometeorology Resource Center Distributed Active Archive Center (GHRC DAAC)

NASA Hurricane and Severe Storm Sentinel (HS3) mission

About the remote sensing data
Platform NASA Global Hawk aircraft
Sensors Various airborne sensors and instruments
Data set Hurricane and Severe Storm Sentinel (HS3) data
Parameters Total vertical velocity, convected vertical velocity
DAAC NASA Global Hydrometeorology Resource Center Distributed Active Archive Center (GHRC DAAC)

The photograph in the title graphic shows Hurricane Isabel, and was taken by astronaut Ed Lu from aboard the International Space Station (ISS). (Courtesy M. Trenchard, Earth Sciences & Image Analysis Laboratory, NASA's Johnson Space Center)

Last Updated