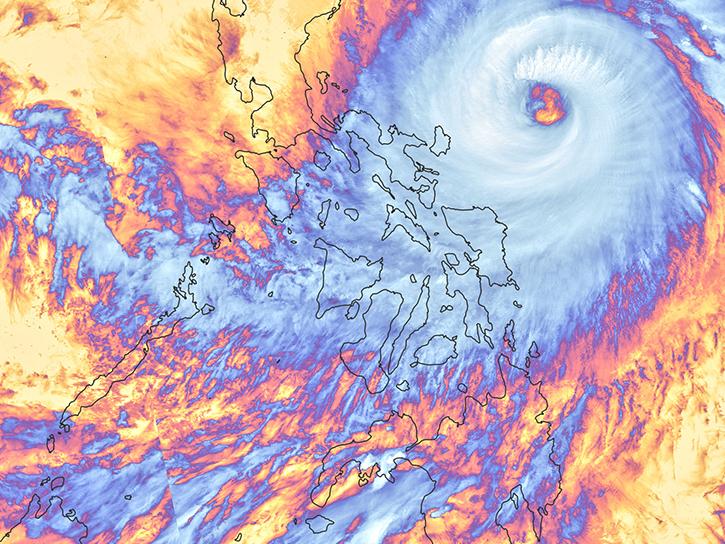
NASA provides a wealth of Earth observing data that can aid in pre-storm emergency preparedness by helping urban planners and emergency management professionals understand the exposure and vulnerabilities to communities. Following a storm, these data are vital tools for damage assessment and response. This toolkit is designed to support research into tropical cyclone-related disasters by providing easy access to data and other resources.
Discover and Visualize Data
Rainfall
Tropical cyclones bring intense amounts of rain over short periods of time, which can lead to flooding in coastal communities. Measuring the location and intensity of rainfall within a storm aids in weather predictions and allows for more rapid and reliable warnings and advisories.
- Discover rain data using Earthdata Search
- Interactively explore rain data imagery in NASA Worldview
- Explore rain data at NASA's Goddard Earth Sciences Data and Information Services Center (GES DISC)
- Explore rain data at NASA's Global Hydrometeorology Resource Center Distributed Active Archive Center (GHRC DAAC)
Webinars
- Data Access and Visualization of Model Data at the NASA GES DISC
- NetCD-what? An Ecologist’s Guide to Working with Daymet and other NetCDF-formatted Data
- Tropical Rainfall Measuring Mission (TRMM) and Global Precipitation Measurement (GPM) Precipitation Products and Services at GES DISC
- Atmospheric Event based Research using GHRC DAAC Tools and Services
Data Tutorials/ Recipes
- Daymet Single Pixel Data Extraction: Web Services
- How to Import MERRA Surface Product Data into ArcGIS
- How to Obtain Data for Conducting a Hurricane Case Study
Sea Surface Temperature (SST)
The temperature of water at the ocean's surface plays a significant role in tropical storms, especially for driving and sustaining these storms. Where sea surface temperatures are high, relatively large amounts of heat energy and moisture enter the atmosphere, sometimes producing intense storms.
- Discover SST data using Earthdata Search
- Discover Multi-scale Ultra-high Resolution (MUR) SST data using Earthdata Search
- Interactively explore SST data imagery in NASA Worldview
- Explore ocean temperature data at NASA's Physical Oceanography DAAC (PO.DAAC)
- Explore ocean temperature data at GES DISC
Webinars
Data Tutorials/ Recipes
- SeaDAS Tutorial: The Basics (Getting Started)
- SeaDAS Tutorial: Masks
- SeaDAS Tutorial: Case Study (Sea Surface Temperature Anomalies)
- PO.DAAC data recipes
Socioeconomic Cyclone-Related Data
Socioeconomic data help assess the exposure and vulnerability of a community to a disaster, such as a tropical cyclone. Exposure is the presence of people, ecosystems, and infrastructure in places that could be adversely affected; vulnerability is the likelihood of being adversely affected.
Flood
- Discover flood hazard data using Earthdata Search
- Discover Global Man-made Impervious Surface (GMIS) data using Earthdata Search
- Interactively explore SST data imagery in NASA Worldview
- Interactively explore flood hazard data imagery in NASA Worldview
- Explore flood-related data at NASA's Socioeconomic Data and Applications Center (SEDAC)
Population
- Discover population data using Earthdata Search
- Interactively explore population data imagery in NASA Worldview
- Estimate population in a user-defined area using SEDAC's Population Estimation Service
- Explore population data at SEDAC
Webinars
- Gridded Population and Settlement Data: An Introduction to the POPGRID Data Collaborative
- Mapping Global Urbanization from Landsat Data and High-Resolution Reference Data
- Remote Sensing Derived Environmental Indicators for Decision Making
Data Tutorials/Recipes
- How to use SEDAC’s Mapping Tool to Visualize Human Built-up and Settlement Extent (HBASE) and Global Man-made Impervious Surface (GMIS) Datasets
- Introduction to the SEDAC Population Estimation Service and Mapping Tool
Sea Level Pressure Data
Atmospheric pressure at sea level is important for the development of tropical cyclonic storms. Low pressure systems generally produce high winds and warmer air, which are ideal for storm formation.
- Discover Modern-Era Retrospective analysis for Research and Applications, Version 2 (MERRA-2) sea level pressure data using Earthdata Search
- Explore MERRA-2 sea level pressure data at GES DISC
Wind Data
A tropical cyclonic storm's sustained wind speed is used to determine its category, which provides an estimate of a storm's destructive power. Being able to forecast and monitor near real-time wind speed is critical for developing estimates of potential property damage from these storms.
- Discover wind data using Earthdata Search
- Interactively explore wind data imagery in NASA Worldview
- Explore wind data at GES DISC
- Download near real-time Multi-angle Imaging SpectroRadiometer (MISR) cloud motion vectors (winds) and radiance data at NASA's Land, Atmosphere Near real-time Capability for EOS (LANCE)
Soil Moisture
Soil moisture data are useful in predicting which local regions in the path of an impending tropical cyclonic storm may experience flooding. Soil moisture controls the amount of water that can infiltrate the ground, replenish aquifers, or contribute to excess runoff.
- Discover soil moisture data using Earthdata Search
- Interactively explore soil moisture data imagery in NASA Worldview
- Explore soil moisture data at GES DISC
- Explore soil moisture data at NASA's National Snow and Ice Data Center DAAC (NSIDC DAAC)
- Explore soils data at NASA's Oak Ridge National Laboratory DAAC (ORNL DAAC)
Webinars
Data Tutorials/Recipes
Humidity, Clouds, and Cloud Top Temperature
One important ingredient for tropical storm formation is high relative humidity values from the ocean surface to the mid levels of the atmosphere. As this warm, humid air rises, it creates extensive areas of clouds, precipitation, and embedded thunderstorms. Strong thunderstorms reaching high into the atmosphere often are associated with very cold cloud top temperatures. These temperature data can also indicate if the strongest storms in a tropical cyclone are being pushed away from the storm's center, indicating wind shear.
- Discover cloud data using Earthdata Search
- Discover relative humidity data using Earthdata Search
- Interactively explore cloud data imagery in NASA Worldview
- Interactively explore humidity imagery in NASA Worldview
- Download near real-time water vapor and relative humidity data through NASA's Land, Atmosphere Near real-time Capability for EOS (LANCE)
- Explore water vapor data at GHRC DAAC
- Interactively explore cloud top temperature data imagery in NASA Worldview
- Explore cloud data at NASA's Atmospheric Science Data Center (ASDC)
- Explore cloud data at NASA's Level 1 and Atmosphere Archive and Distribution System DAAC (LAADS DAAC) (search with keyword cloud)
Assessing Flood Inundation with Land Surface Reflectance Data and Imagery
Understanding and mapping flood inundation is critical for assessing the scope of a tropical cyclone, determining where damage is greatest, and facilitating relief efforts.
- Discover land surface reflectance data using Earthdata Search
- Interactively explore land surface reflectance imagery in NASA Worldview
- Interactively explore MODIS Corrected Reflectance Bands 7-2-1 in NASA Worldview
- Interactively explore VIIRS Corrected Reflectance Bands 11-I2-I1 in NASA Worldview
- Explore surface reflectance data at LP DAAC
Webinars
- NASA ORNL DAAC MODIS and VIIRS Data Tools and Services at your Fingertips
- Navigating NASA's LP DAAC to Find Answers to your Deepest Land Data Questions
- R you Ready to Python? An Introduction to Working with Land Remote Sensing Data in R and Python
- Exploring Earth’s Land Surface with Suomi NPP NASA VIIRS Land Data
Data Tutorials/Recipes
- Getting Started with VIIRS Surface Reflectance Data: All about Accessing the Data
- Getting Started with VIIRS Surface Reflectance Data: Using the Data
- Getting Started with NASA MODIS Version 6 Surface Reflectance Data: All about Accessing the Data
- Getting Started with NASA MODIS Version 6 Surface Reflectance Data: Using the Data
- Getting Started with NASA MODIS Version 6 Surface Reflectance Data: Interpreting Quality Information
Assessing Flood Inundation with Synthetic Aperture Radar (SAR) Imagery
Understanding and mapping flood inundation is critical to assessing the scope of a disaster, where damage is greatest, and how to respond with relief efforts. SAR imagery is a valuable tool for assessing post-storm flood and storm-surge damage along with landscape and coastline changes caused by cyclonic storms. The wavelengths used for creating SAR imagery can penetrate clouds, smoke, soil, ice, and tree canopies, meaning that high-relief SAR imagery can be created day or night, rain or shine.
- Discover SAR data using Earthdata Search
- Discover and download SAR Data at NASA's Alaska Satellite Facility DAAC (ASF DAAC)
Webinars
Data Tutorials/Recipes
- Earthdata Backgrounder: What is SAR?
- How to Map Regional Inundation with Spaceborne L-band SAR using ArcGIS
- How to Map Regional Inundation with Spaceborne L-band SAR using QGIS
- How to Map Regional Inundation with Sentinel-1 using Sentinel-1 Toolbox
Detecting Power Outages Using the Visible Infrared Imaging Radiometer Suite (VIIRS) Day/Night Band (DNB)
VIIRS DNB imagery show Earth’s surface and atmosphere using a sensor designed to capture low-light emission sources under varying illumination conditions. This product is an excellent resource for assessing power outages across large areas. NASA's Black Marble product removes cloud-contaminated pixels and corrects for atmospheric, terrain, vegetation, snow, lunar, and stray light effects on the VIIRS DNB radiances and enables nightlight data to be used effectively for scientific observations.