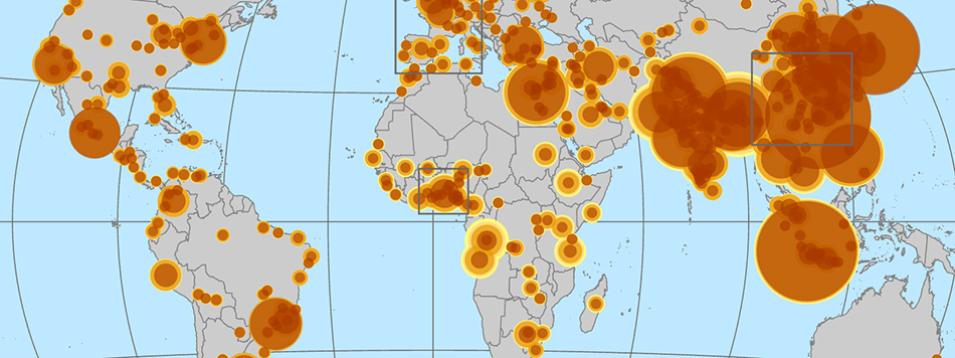
Cities are home to more than half the world's population. They are engines of economic activity that have experienced much faster population growth rates than rural areas, especially in the developing world. Built up lands also represent an important land use, and urban encroachment on agricultural and biodiverse lands has been an issue in many regions. Finally, urban populations are diverse and environmental pollutants can be high, which means that populations are marked by inequalities with differential vulnerabilities to environmental and climate exposure. In this webinar, experts from SEDAC and Columbia University’s Center for International Earth Science Information Network (CIESIN) provide an overview of NASA's SEDAC urban datasets and their potential uses in navigating urban complexities in the context of climate change and sustainable development.
We are in the process of migrating all NASA Earth science data sites into Earthdata from now until end of 2026. Not all NASA Earth science data and resources will appear here until then. Thank you for your patience as we make this transition.
Read about the Web Unification Project
