In the past, scientists typically relied on SAR imagery from the European Remote Sensing (ERS) satellites, ERS-1 and ERS-2, to map earthquake deformation. But ERS-1 failed in 2000, and ERS-2 began malfunctioning shortly afterwards. So Ford and his colleagues turned to SAR imagery from RADARSAT-1 (a satellite managed by the Canadian Space Agency), which had never before been applied in earthquake interferometry.
One of the biggest challenges with SAR imagery is the infrequency of satellite observations. In that respect, RADARSAT-1 had an advantage over the ERS missions. “RADARSAT-1 repeats its orbit every 24 days, whereas ERS-1 and ERS-2 repeated every 35 days,” said Ford. Surface changes occurring between orbits (such as excessive rainfall or snowfall, or changes in vegetation) can cause “noise” in interferograms, making them less accurate. “The less time between repeat orbits, the less chance there is for change on the Earth’s surface,” said Ford.
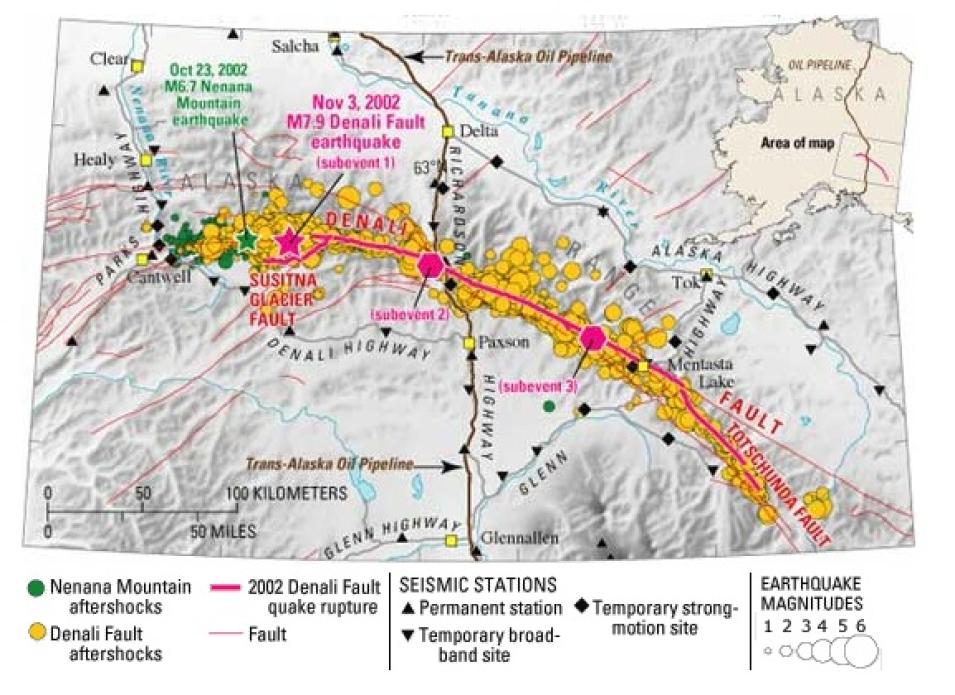
After the November 3 earthquake, Ford and his colleagues contacted the Alaska Satellite Facility (ASF) in Fairbanks. “ASF gave us priority. Once the satellite acquired the image we needed, ASF downloaded and formatted it, and it was ready for us within hours,” said Ford. Fortunately, ASF had images from October 5 (prior to the foreshock earthquake), October 29 (between the two earthquakes), and November 22 (after the second earthquake) that included the area of both earthquakes’ epicenters.
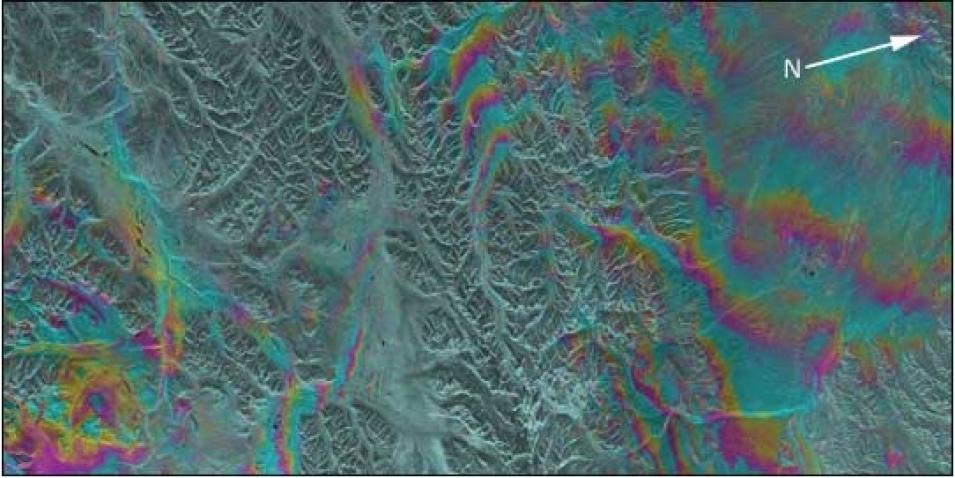
ASF’s fortuitous collection of images allowed Ford and his colleagues to make a series of three interferograms: one for each of the earthquakes, and a cumulative interferogram that includes both earthquakes. “It’s the first time this has ever been done in earthquake research. Every pair of SAR images used in the past has straddled both the major foreshocks and the mainshock. Now we can actually separate the two quakes,” said Ford.
