For many people, knowing that an event is occurring is an integral first step in discovering the reasons behind why an event is occurring. For example, you might look outside to conduct a quick visual analysis of the data (it is cloudy and rain is falling) and use this observation to make an initial assessment of what this means – you need an umbrella. When you have more time, you might pull up National Weather Service (NWS) data to see the reasons behind what you observed: that a cold front created a disturbance that led to the rain. Visualized data – seeing rain falling – was your first step in data discovery.
The same is true for users of NASA Earth observing data: turning instrument data into an image of a natural event or sensor output, such as a dust storm or a measurement of atmospheric ozone concentrations, allows scientists and researchers to conduct an initial assessment of the data and make inferences about the potential significance of what they are seeing in the image. After this initial visual assessment, the data behind the image, including more heavily processed science-quality data, can be downloaded for detailed analysis and research.
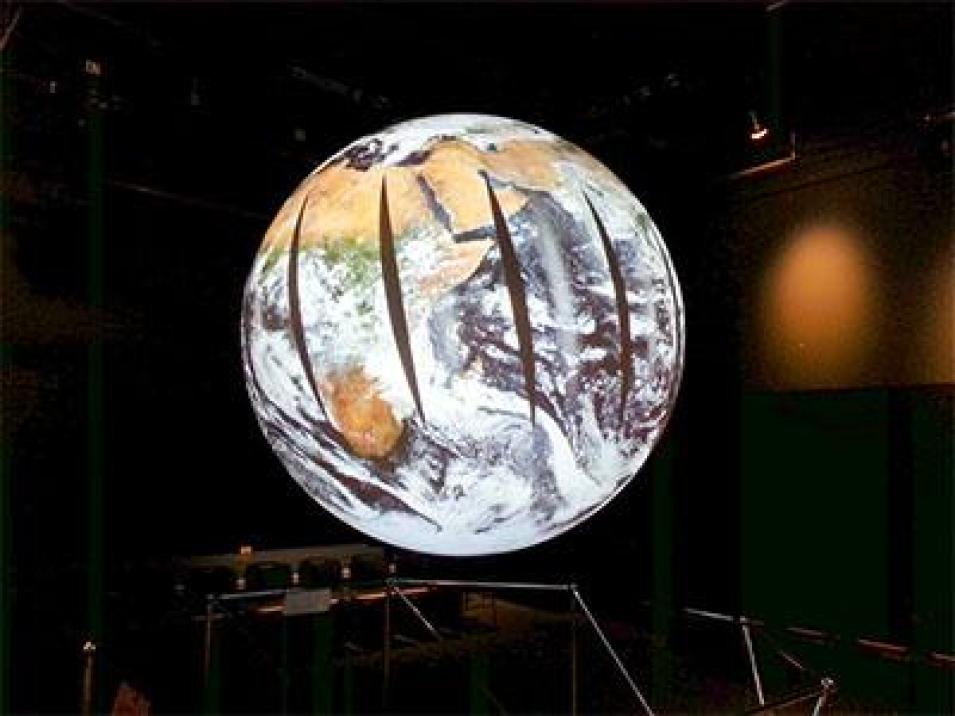
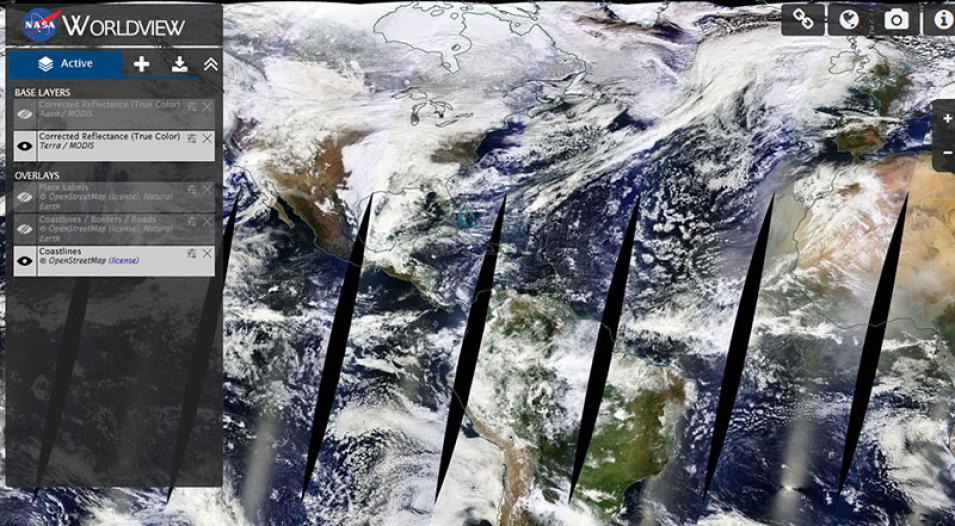
This all sounds like a simple process, but the sheer amount of NASA Earth observing data makes discovering specific data products or the right data products a challenge. One way NASA addresses this challenge is through visualizations of satellite data that are provided through NASA’s Global Imagery Browse Services (GIBS) that can be browsed and viewed using the Worldview interactive interface.
One important aspect of Worldview is that it is not part of GIBS, but, rather, sits on top of GIBS. This allows people to build their own clients that can retrieve GIBS imagery or to use imagery provided through GIBS in other venues, such as for educational websites, planetarium shows, or environmental forecasting.


