The Surface Water and Ocean Topography (SWOT) satellite collects data on the global ocean and the major water bodies that comprise Earth's freshwater resources. Over time, these data will make it easier for researchers to analyze how waterbodies are responding to climate change and the impacts of human activity on Earth's freshwater systems.
Yet as the SWOT mission goes on and the volume of data grows, finding, accessing, and analyzing specific files pertaining to a particular body of terrestrial water or water feature may become more challenging.
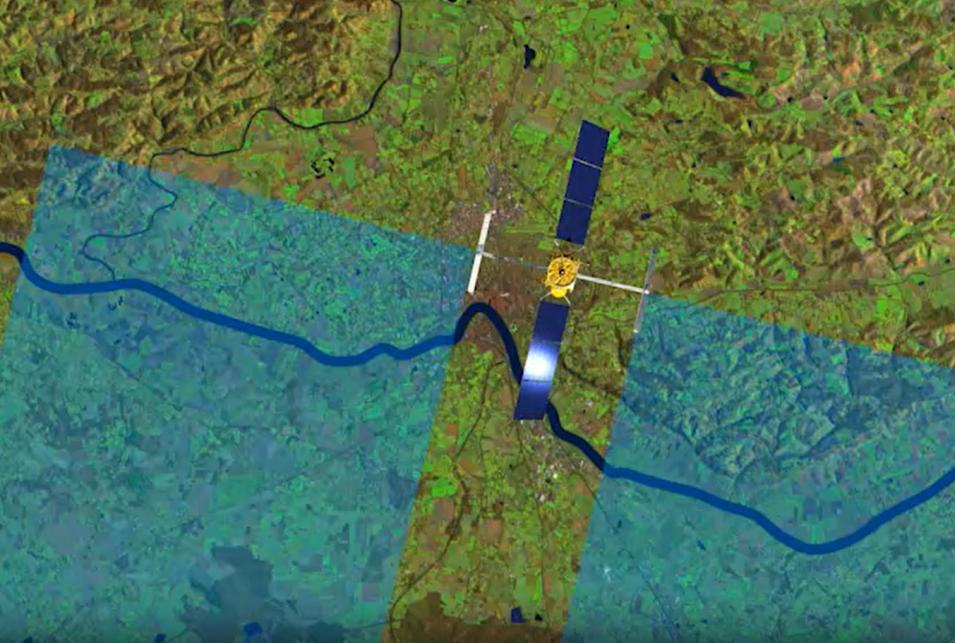
"As SWOT orbits the planet, it will cross a continent at a particular time and observe the rivers, lakes, reservoirs, and wetlands beneath it. The data collected during that pass are contained in one data file for each water body type. Then, SWOT will come around later and do another pass at a slightly different angle and time over that area, and that will be another file," said Victoria McDonald, scientific applications software engineer at NASA's Jet Propulsion Laboratory (JPL) in Southern California. "So, if users want to look at one river or one section of a river and see how it has changed over time, they'll need to find all of the individual files at all of the individual times the satellite passed over. That can be hundreds of files, and users may find it difficult to find and process all of the files they need."
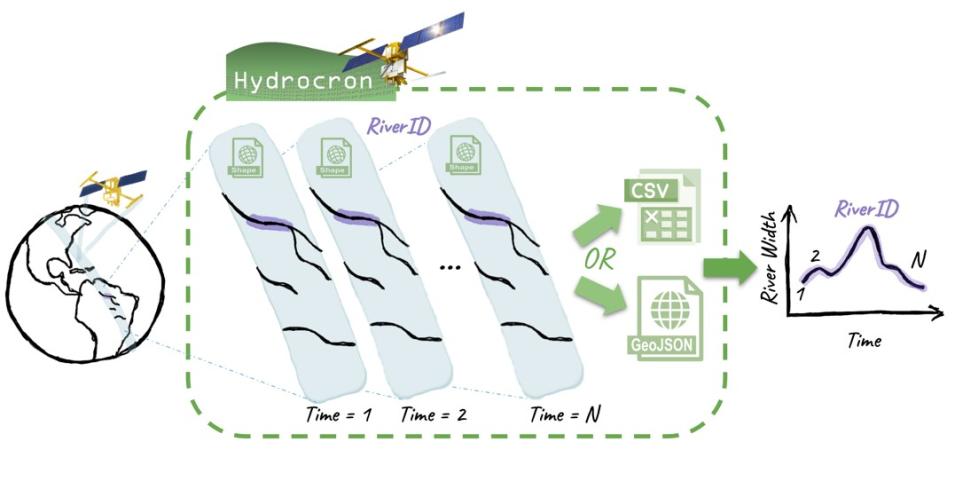
SWOT river data are archived and distributed as zipped shapefiles, which are not cloud optimized. Further, the files are organized by passes of the SWOT satellite over the continents, so each zip file contains data on river features observed at a specific time. This means that to analyze the way a particular water body has changed over time, users need to extract data for a single feature from a large number of files in the archive.
To help users find and analyze the data they need, NASA's Physical Oceanography Distributed Active Archive Center (PO.DAAC) created Hydrocron, an application programming interface (API) that allows users to specify the identifier (ID) of a single river reach or node (section or point along a river) of interest and then receive all SWOT observations within the specified date range. The only dataset currently included in Hydrocron is the SWOT Level 2 River Single-Pass Vector Data Product, Version 2.0; inclusion of the SWOT lake product is in development and slated for release in late-September.
"Hydrocron facilitates time series analysis. That's what we've tried to make easier for users," McDonald said. "It's an API, which is an intermediate service, so there may be a steep learning curve for new data users. Once they get familiar with doing this sort of analysis, they'll see how it will return all of the available data for their defined river feature ID and the time period."
How Hydrocron Works
Hydrocron is powered by Amazon Web Services (AWS) using API Gateway, Lambda functions, DynamoDB tables, and SNS notifications. As data are ingested into the PO.DAAC archive, SWOT shapefiles are unpacked and each river reach (a 10-km section of a river) and node (a point every 200 meters along a reach) is added to a database.
Users can query the API with a feature ID (i.e., the specific ID of the reach or the node that a user is interested in), a time range of interest (both a start and an end date), and their desired data format (GeoJSON or CSV). Users should note that the SWOT satellite may observe lakes and rivers that do not have an ID listed in prior databases. In these cases, hydrology features are added to the Unassigned Lakes data product; Hydrocron does not support unassigned rivers and lakes at this time.
The Hydrocron API can be applied to a variety of applications, said Dr. Catalina Taglialatela, applied science systems engineer at JPL and PO.DAAC.
"Another advantage of the API service is that it offers access to SWOT time series data in ways that apply to multiple use cases," Taglialatela said. "Through Hydrocron, you can pull data and analyze [the data] programmatically, in code, Jupyter notebooks, pull it into models for data assimilation or for large-data processing, or use [the data] on the backend to support dashboards that offer visualization and data access."
Open Source and Open Science
According to McDonald, the involvement of the USGS and other partners in Hydrocron’s development has been a great example of the success that can result from working in a collaborative, open science environment.
"Hydrocron was developed with consultation from the USGS and other stakeholders who realized very early on that they wanted to be involved in a tool like this," she said. "And so, we've been doing all of our development in the [PO.DAAC] GitHub repository. Every time we add a new feature or are considering how something is going to work, we write it up in GitHub and get comments from our stakeholders before we make any decisions. It's been a very successful example of open source and open science."
Dr. Cassandra Nickles, applied science systems engineer at PO.DAAC, agreed and added that the collaborative development and adaptability of Hydrocron show that APIs offer an attractive way to make NASA Earth science data more accessible.
"Hydrocron gave us the opportunity to come together as a community and make SWOT data more accessible for so many people," she said. "We got to design and build this tool and make it open so that other people could replicate it. This could be the future of how the DAACs make data more accessible for people. Hopefully, SWOT is just the beginning, and we can build something like this for a lot of different data products."