Permafrost is a layer of ground that remains frozen all year round. It often sits beneath a layer of soil that thaws seasonally. Due to rising temperatures, some areas of permafrost are thawing for the first time in years, which releases gases and organic carbon that have profound effects on the surrounding ecosystem. Thawing permafrost can also lead to landslides and erosion that pose danger for infrastructure and wildlife.

Instruments aboard NASA’s Earth-observing satellites cannot measure permafrost directly, but they can collect soil moisture data through radiometry. This helps scientists estimate the status of permafrost around the world. NASA’s data useful to the study of permafrost also include measures of soil carbon, estimates of permafrost active layer thickness, vegetation data, temperature data, and land surface data. 

Get Permafrost Data

Access a range of datasets and data tools to further your permafrost research.

Learn How to Use Permafrost Data

Access a range of webinars, tutorials, data recipes, and data stories to enhance your knowledge of Earth Observation data.
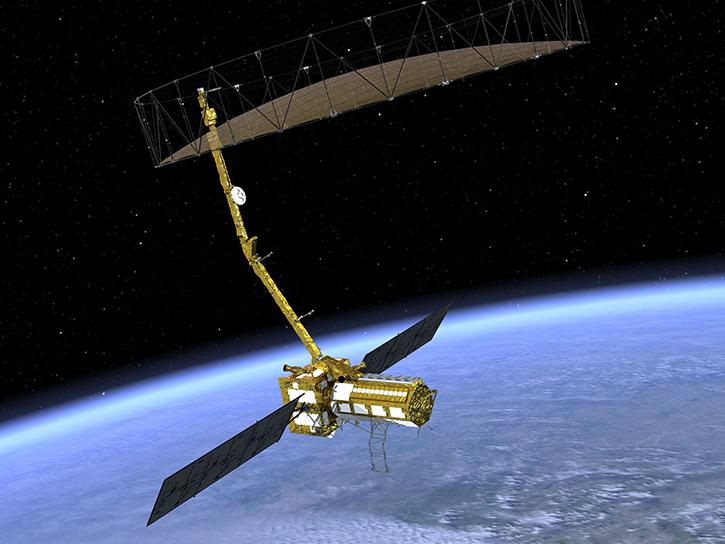
image of NISAR satellite in orbit
NISAR Early Adopter Workshop, Day 2: MintPy HyP3 InSAR Permafrost Tutorial
This presentation from Day 2 of the NISAR Early Adopter Workshop on 01/24/2024 includes a demo of an InSAR workflow with HyP3 and OpenScienceLab.
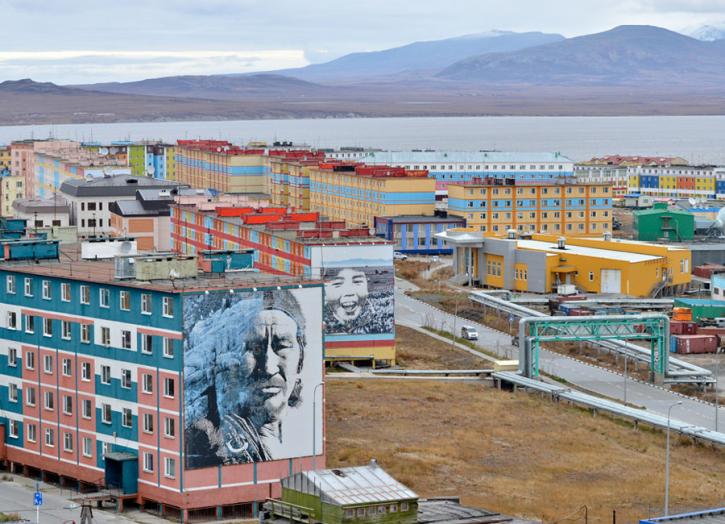
Photograph of buildings on piles in Anadyr, Russia
A Spread of Green
People and heat spread north into Arctic permafrost.
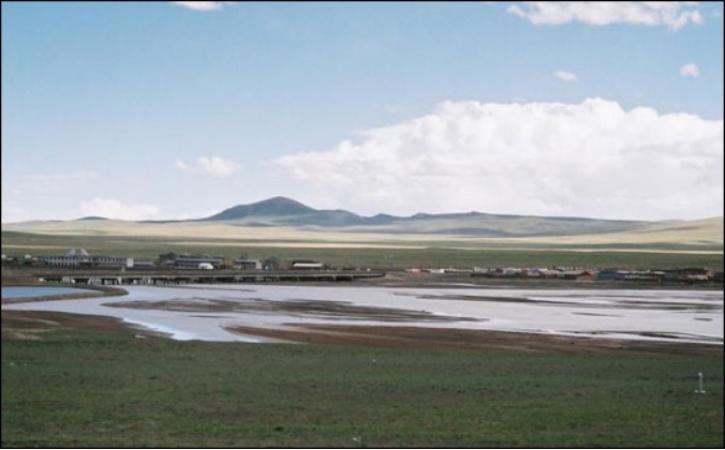
TuotuoHeyan Tibet
Riding the Permafrost Express
Researchers use innovative techniques to protect the newly constructed Qinghai-Xizang railroad across the Tibetan Plateau from permafrost.
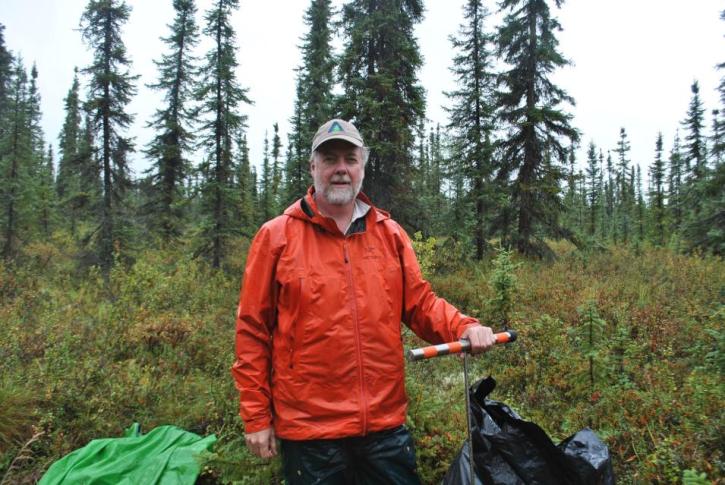
Dr. Kevin Schaefer measuring thaw depth in the rain near Fairbanks Alaska, 2017.
Data User Story: Dr. Kevin Schaefer
Learn how data from NASA’s ORNL DAAC help scientists like Dr. Kevin Schaefer detect climate-induced thawing of permafrost throughout the Arctic.
Discover and Visualize Permafrost Data
NASA data help us understand Earth's changing systems in more detail than ever before, and visualizations bring these data to life, making Earth science concepts accessible, beautiful, and impactful.
Data visualization is a powerful tool for analysis, trend and pattern recognition, and communication. Our resources help you find world-class data visualizations to complement and enhance your research. We also have tools and tutorials to help you translate permafrost data into compelling visuals.
Image
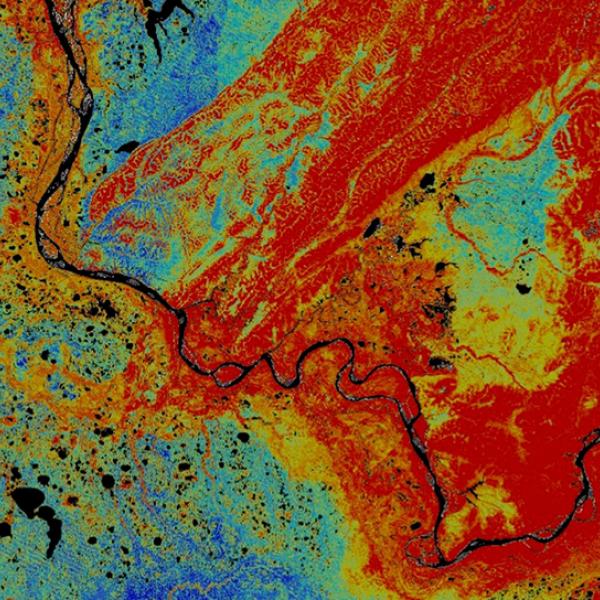
WELD mosaic of permafrost in the Yukon river
This derived permafrost map used Web-Enabled Landsat Data (WELD) to model probabilities of near-surface permafrost distributions. Credit: Neal Pastick / USGS.

Join Our Community of NASA Data Users

While NASA data are openly available without restriction, an Earthdata Login is required to download data and to use some tools with full functionality.

Learn About the Benefits of Earthdata Login

Frequently Asked Questions

Earthdata Forum

Our online forum provides a space for users to browse thousands of FAQs about research needs, data, and data applications. You can also submit new questions for our experts to answer.

Submit Questions to Earthdata Forumand View Expert Responses
Earthdata
Forum