ESDIS Weekly Metrics: September 21, 2026

Image

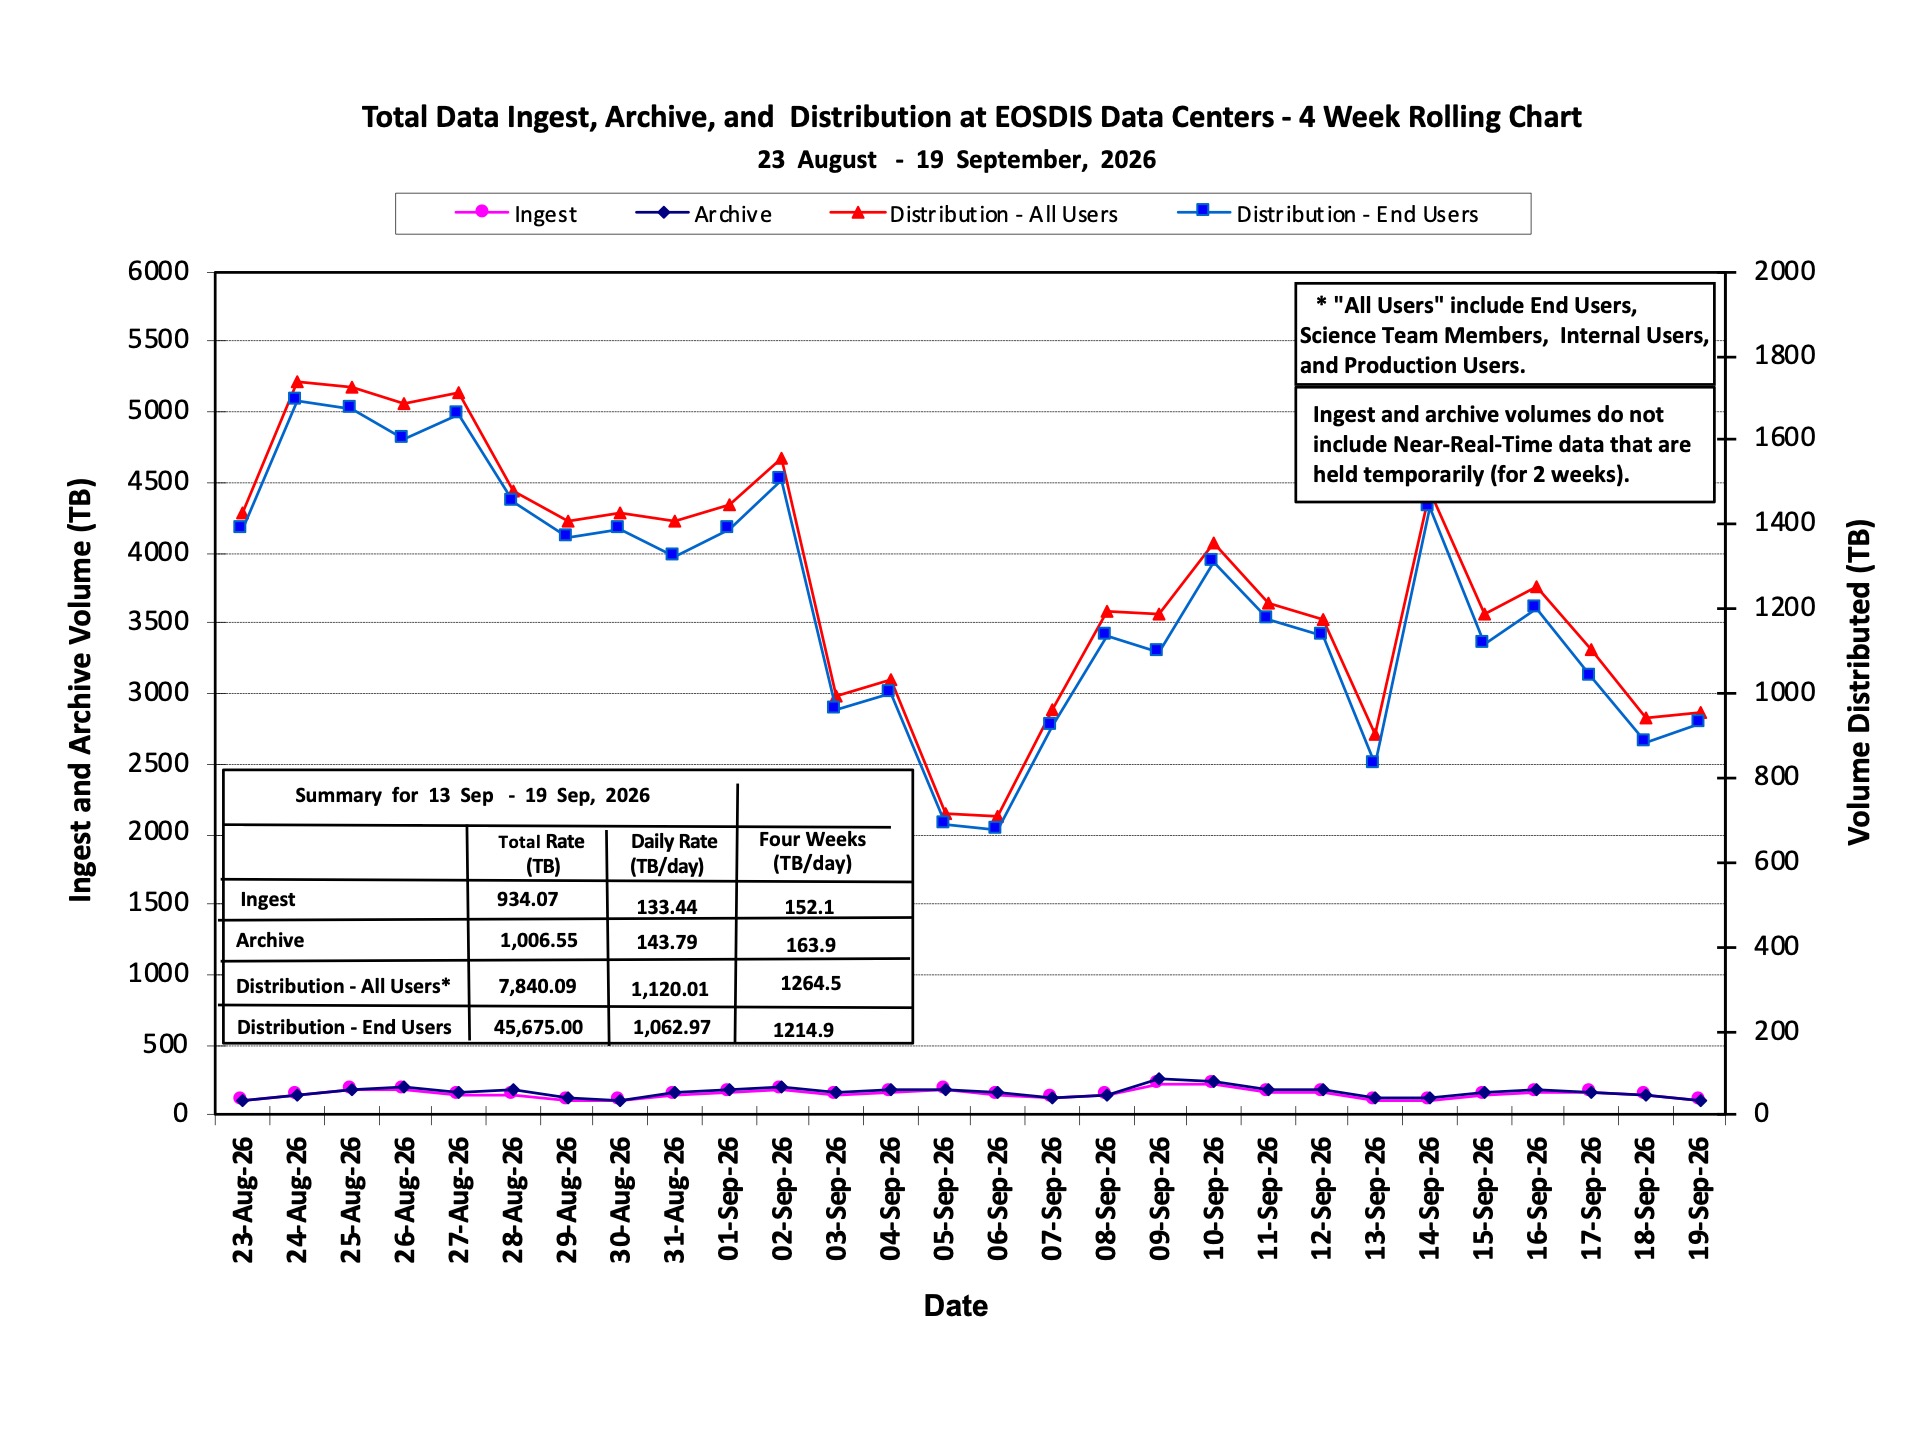
Note: The volume distributed to end users per day, as a running average over the past four weeks, is 7.411 times the volume added to the archive per day.

Image

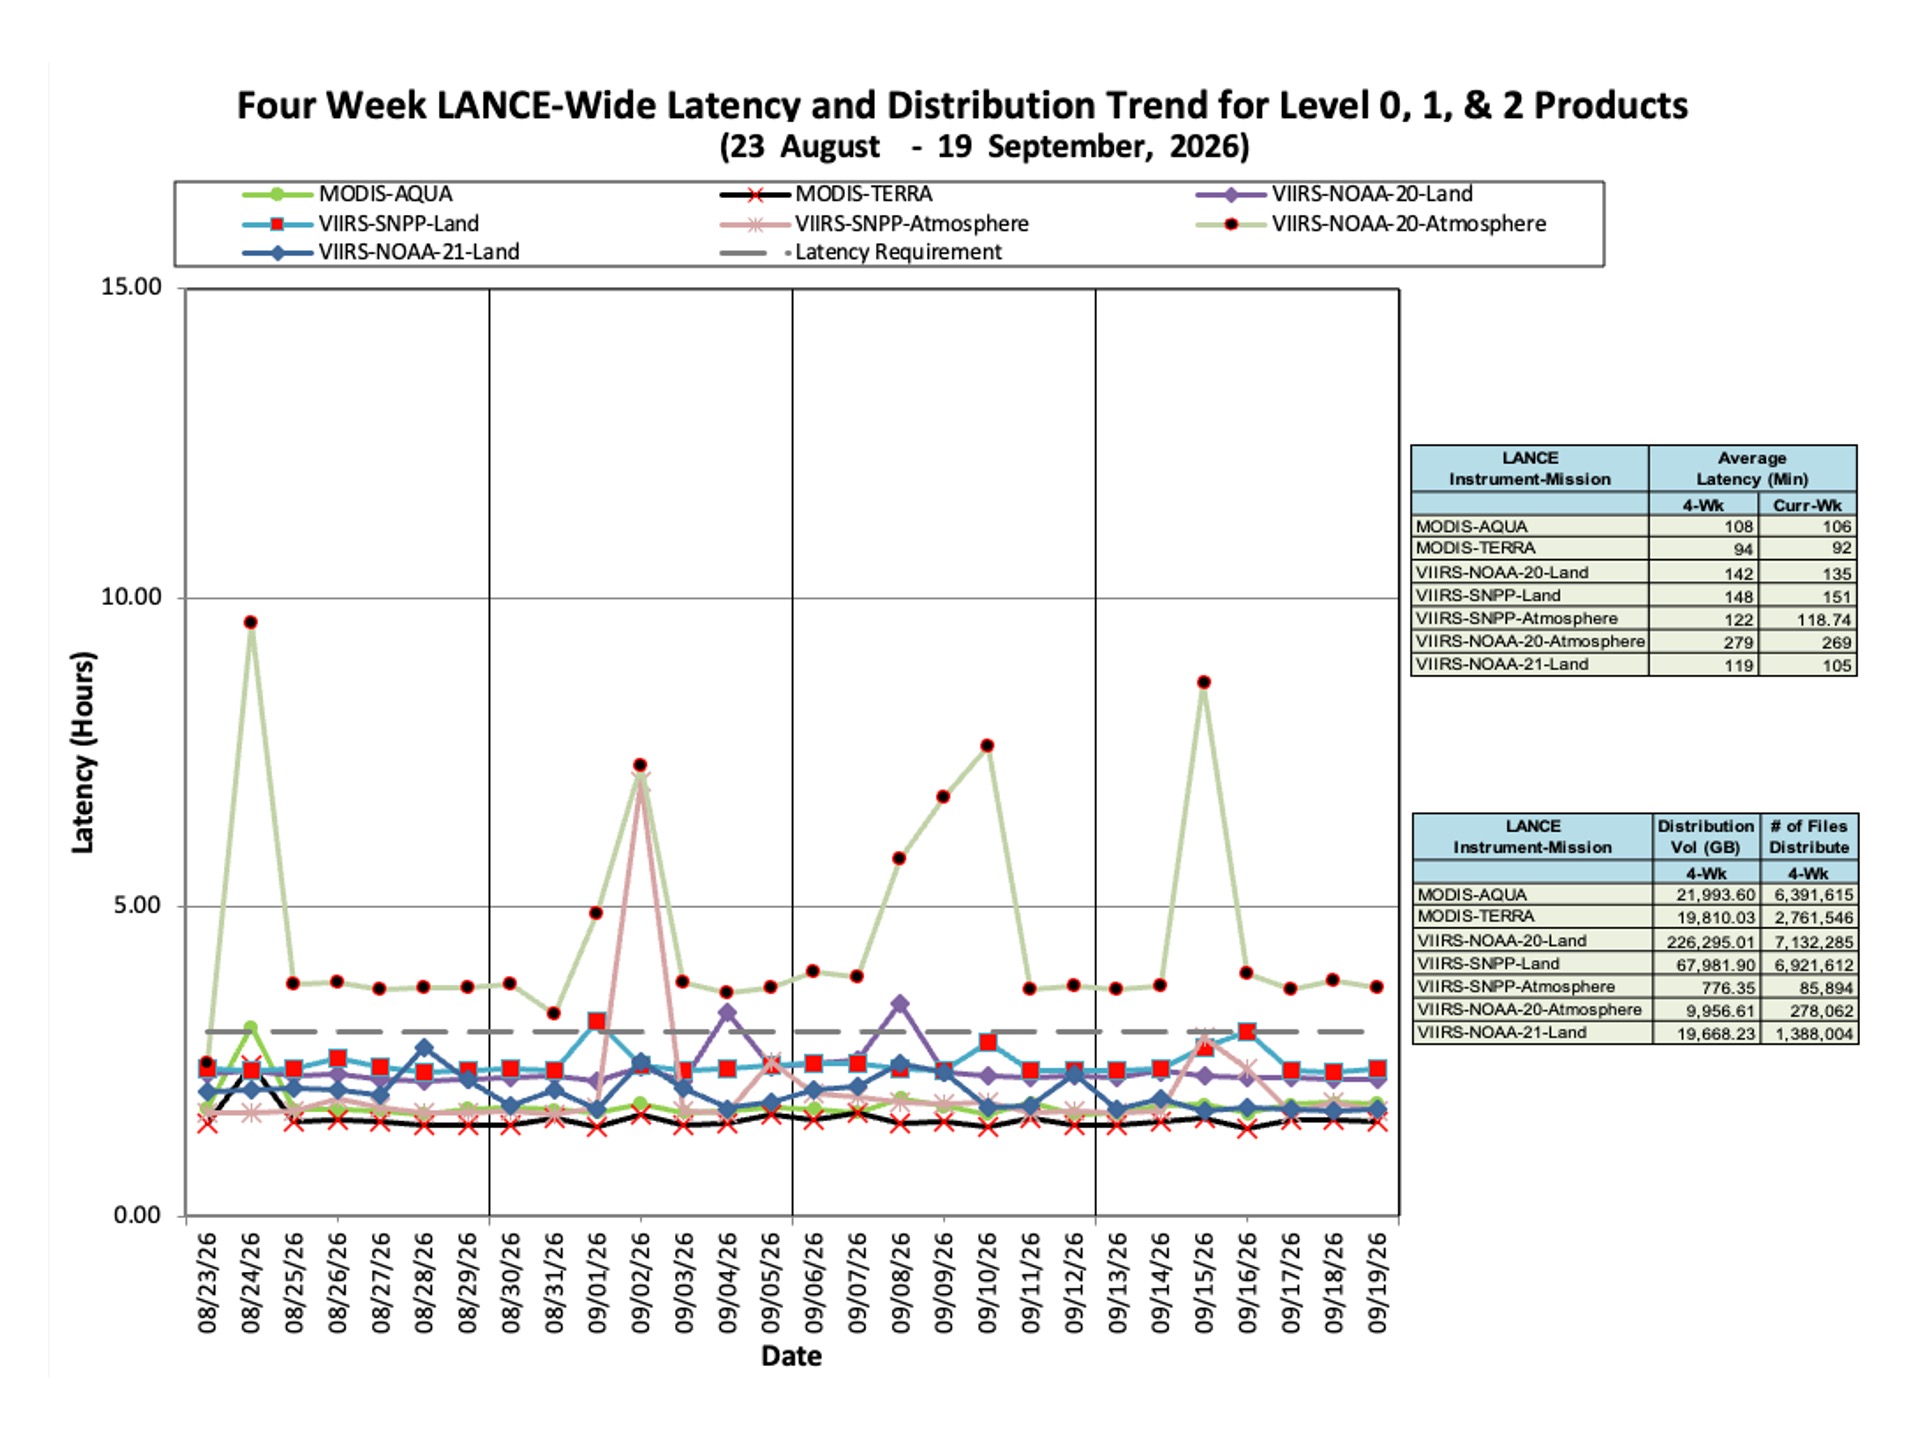
Note that higher product latencies for:

  • VIIRS-NOAA-20-Atmosphere from August 30 to September 5, 2026, were due to an unexpected service outage. 
  • VIIRS-SNPP-Atmosphere on September 2, 2026, were due to an unexpected service outage. 
  • VIIRS-NOAA-20-Atmosphere from September 6-12, 2026, were due to an upstream delay. 
  • VIIRS-NOAA-20-Atmosphere from September 13-19, 2026, were due to an upstream delay.
Image

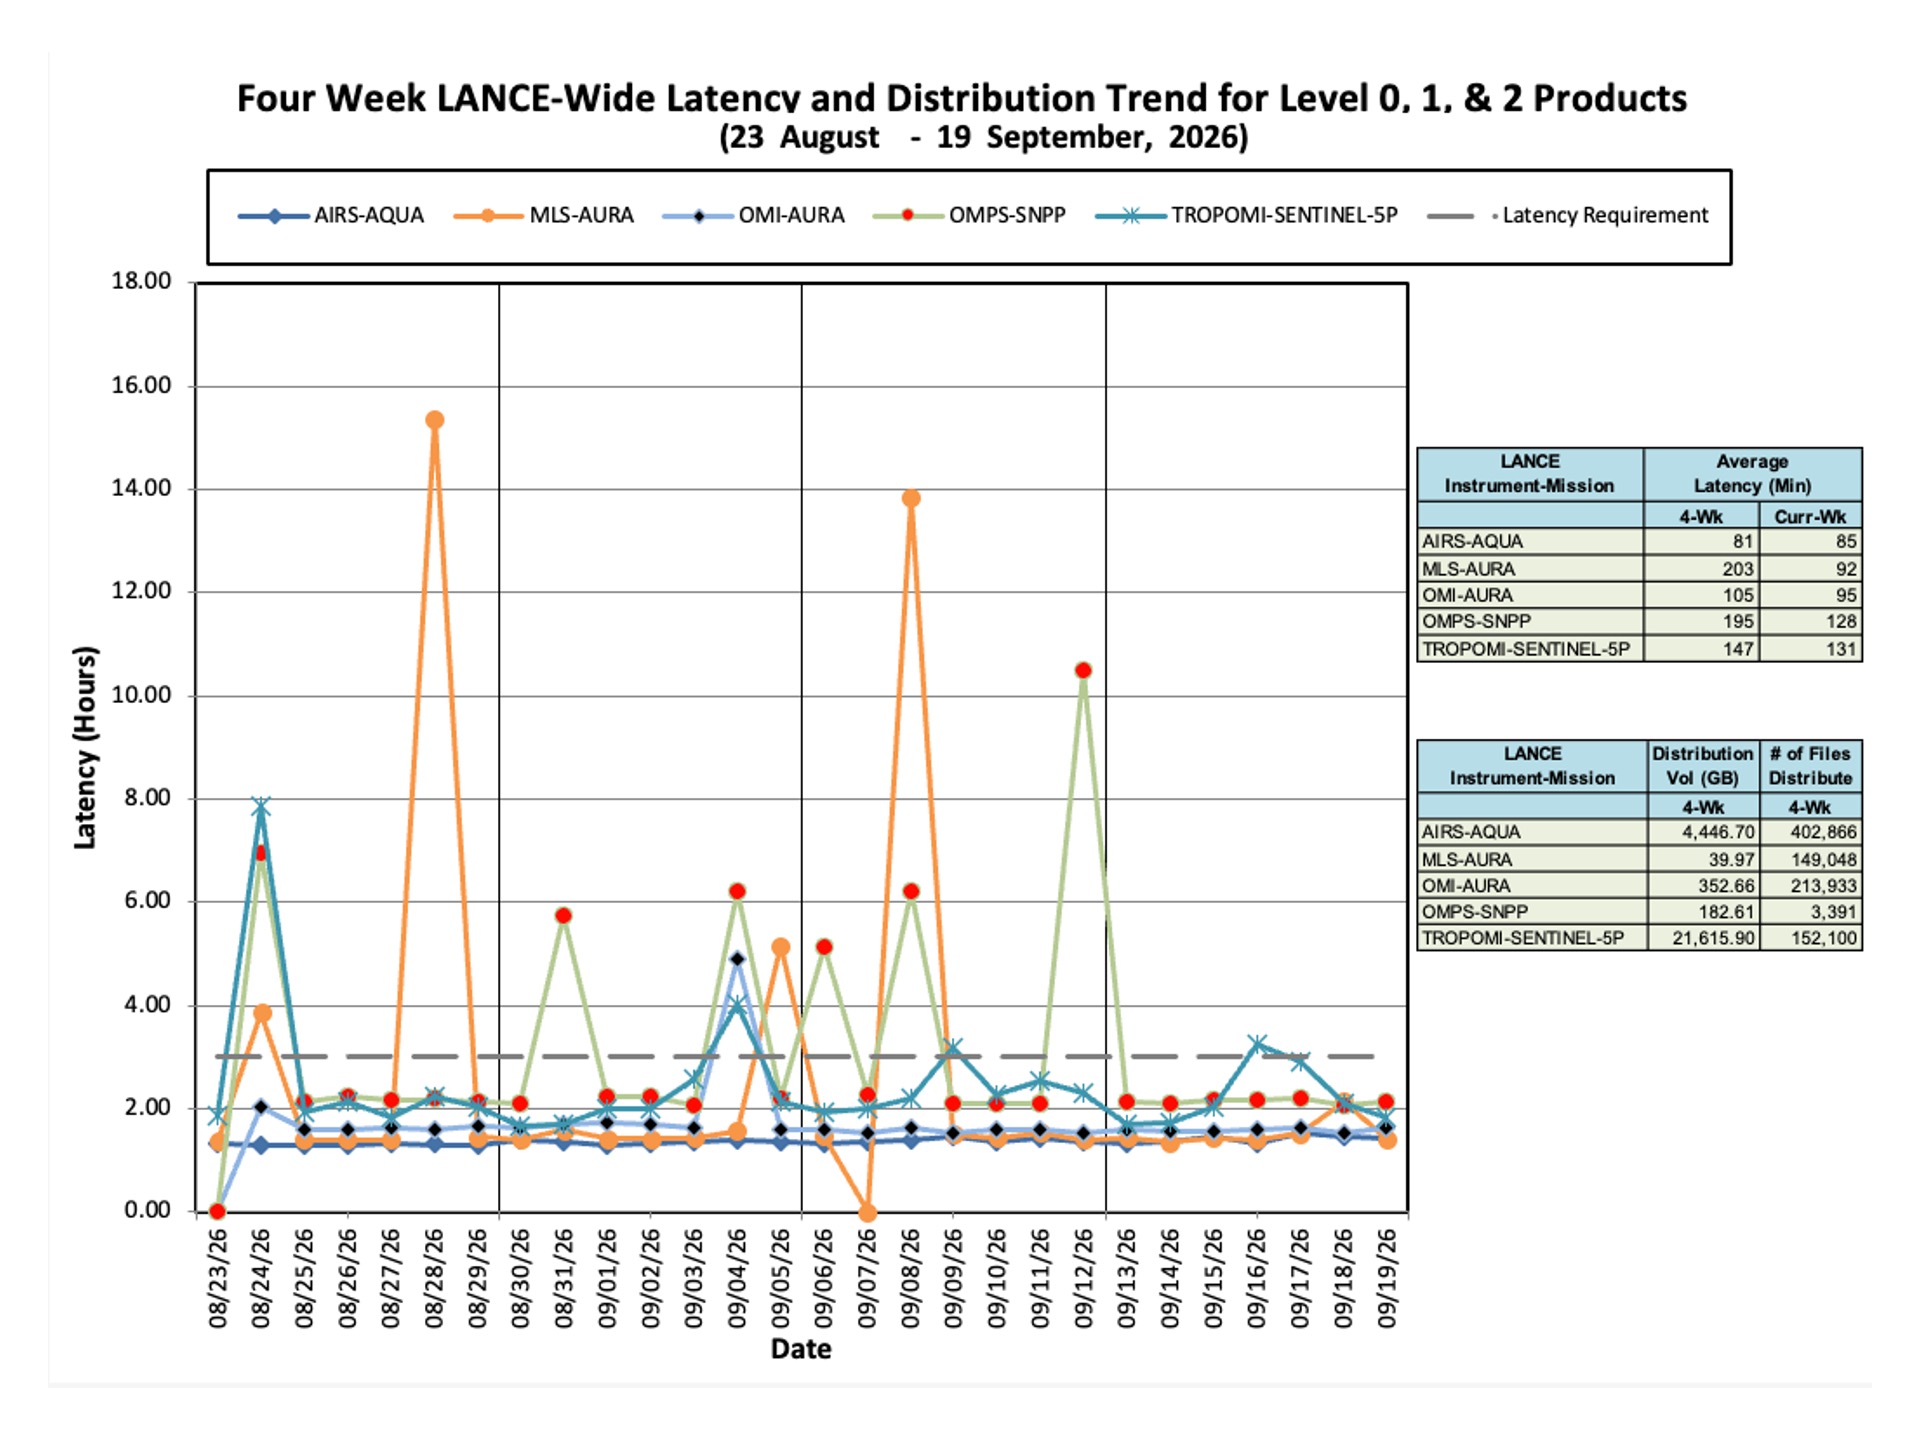
Note that higher product latencies for TROPOMI-SENTINEL-5P on September 16, 2026, were due to a couple of files failing.

Image
Image

Notes:

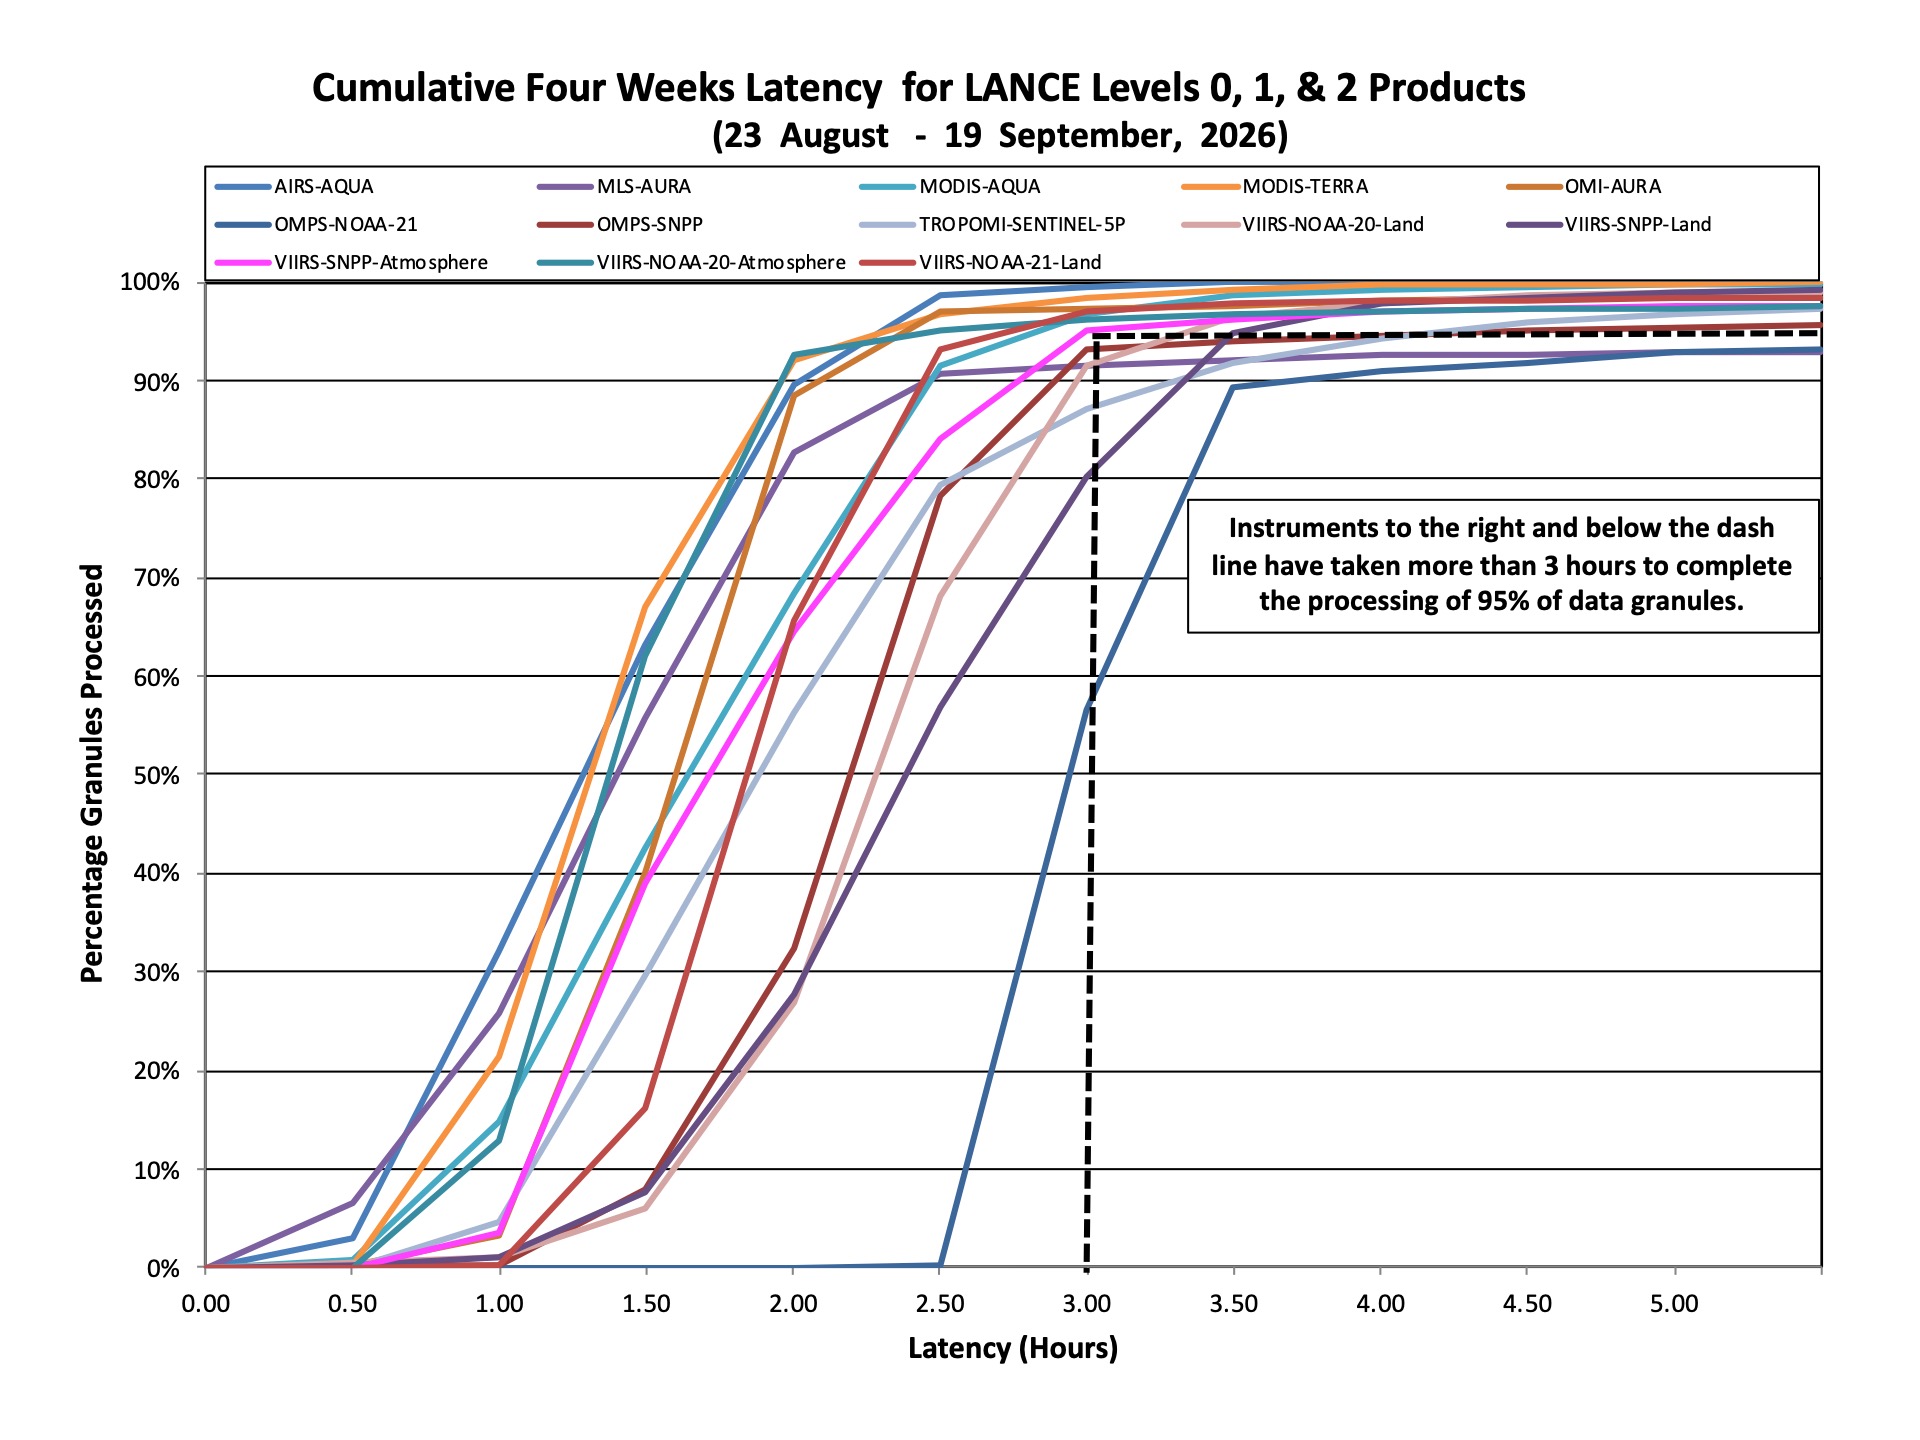
  • Latency for a data granule is defined as the time taken from the midpoint between the start and end of acquisition of the data to the granule being ready on-line for users to download.
  • Duration covered by the data for a granule is defined differently for four different instruments (e.g., MODIS granules are 5 minutes long, while OMI NRT granules are 13 to 136 minutes long).
  • Over the past four weeks, more than 95% of near-real time (NRT) data requests for nearly all instruments were satisfied within 3 hours. The exceptions were MLS-AURA, OMPS-NOAA-21, OMPS-SNPP, TROPOMI-SENTINEL-5P, VIIRS-NOAA-20-Land, and VIIRS-SNPP-Land, which had rates of 92%, 57%, 93%, 87%, 92%, and 80%, respectively, of NRT data requests being satisfied within 3 hours.

Gobal Imagery Browse Services (GIBS)

Image

Worldview

Image