Urban Extreme Heat Dataset Offers Population Exposure Estimates for More Than 13,000 Urban Settlements Worldwide

A new SEDAC dataset provides the most accurate record of how extreme heat in urban areas across the globe has changed.
author-share
Image
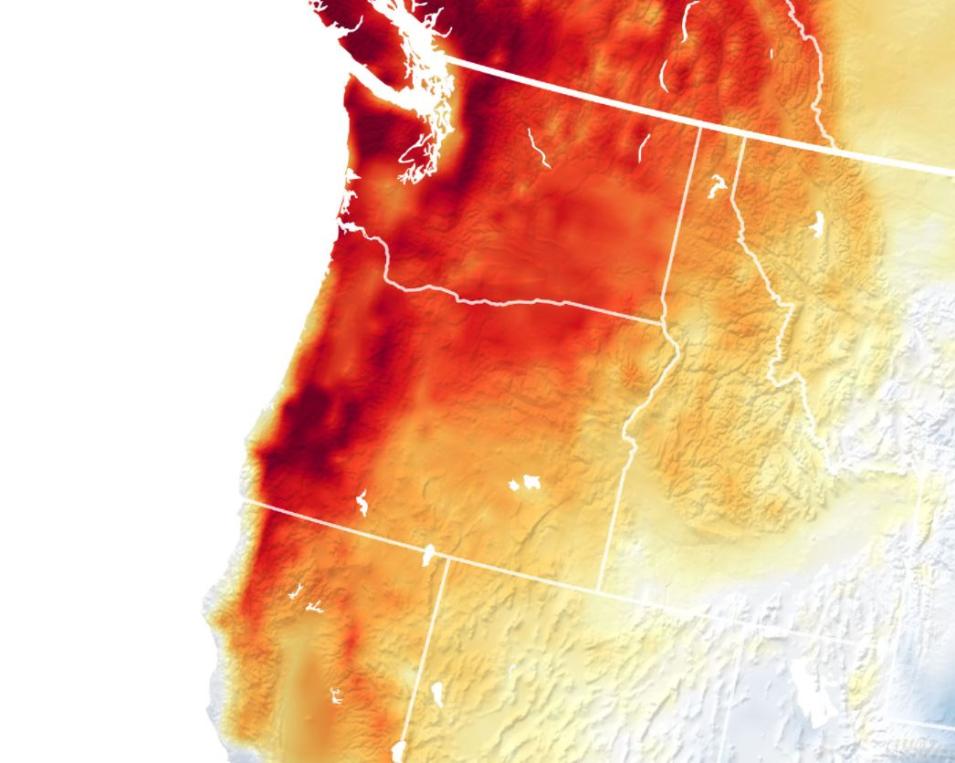
This map shows air temperature anomalies across the continental United States and Canada on June 27, 2021. The map is derived from the Goddard Earth Observing System model and depicts air temperatures at 2 meters (about 6.5 feet) above the ground. Red areas show where air temperatures climbed more than 27°F (15°C) higher than the 2014–2020 average for the same day. Credit NASA Earth Observatory

“Historic and dangerous”—that’s how the National Weather Service characterized the heat wave that roasted the Pacific Northwest at the end of June 2021, when all-time temperature records fell in multiple cities in the United States and Canada. On June 25, surface temperatures in Seattle reached 120°F (49°C) and, the next day, excessive heat warnings were issued across Washington, Oregon, and Northern California.

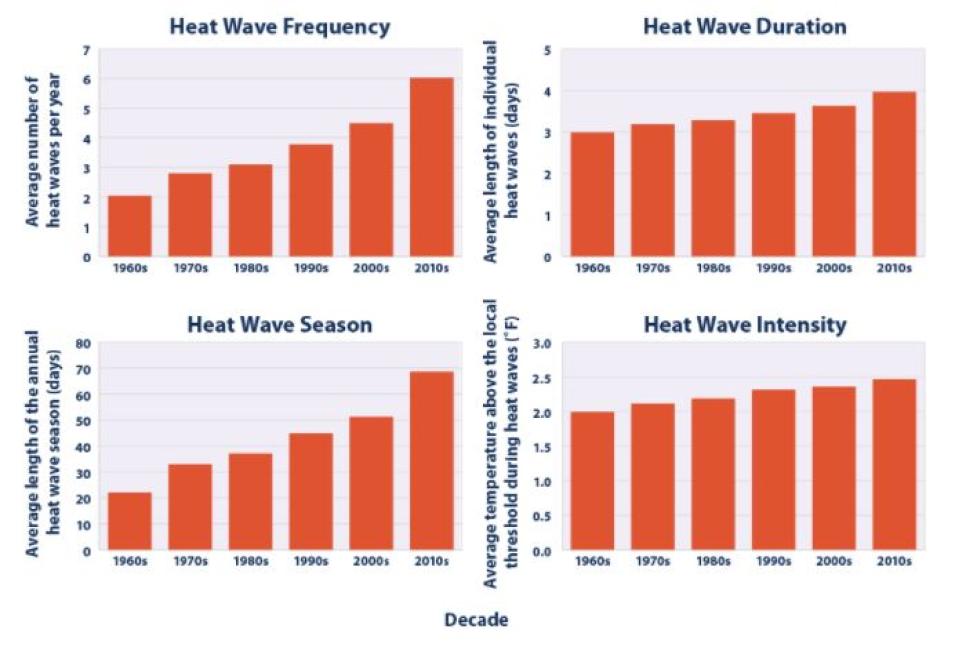
Of course, summer heat waves are nothing out of the ordinary, as unusually hot days are a natural part of day-to-day variation in the weather. However, according to information from the EPA, heat waves have become more frequent, longer-lasting, and more intense since the 1960s. Such findings are significant given that heat waves are more than just uncomfortable. Extreme heat can lead to illness and even death, particularly among older adults, the very young, and other vulnerable populations. In fact, according to reports from The New York Times, CNN, The Guardian, and other news outlets, the Pacific Northwest heat wave mentioned above killed more than 200 people in the region.

Therefore, as extreme heat events become more frequent, they’re likely to result in more heat-related illnesses and deaths, especially in communities that lack the resources to adapt. Yet, pinpointing which populations are most at risk can be difficult given the limited data pertaining to both urban population and extreme heat.

NASA’s Socioeconomic Data and Applications Center (SEDAC) has sought to address this limitation with the release of its Global High Resolution Daily Extreme Urban Heat Exposure (UHE-Daily), 1983–2016 dataset.

The new UHE-Daily dataset contains geolocated extreme heat events and urban population exposure estimates for more than 13,000 urban settlements worldwide from 1983 to 2016. Urban extreme heat events and urban population exposure are identified for each settlement in the data record at five combined temperature-humidity thresholds:

  • Two-day or longer periods where the daily maximum heat index is greater than 40.6° Celsius (105° Fahrenheit)
  • One-day or longer periods where the daily maximum heat index is greater than 46.1° Celsius (114° Fahrenheit)
  • One-day or longer periods where the daily maximum wet bulb globe temperature—a measure of the heat stress in direct sunlight that comprises temperature, humidity, wind speed, sun angle, and solar radiation—is greater than 28, 30, and 32° Celsius (82.4, 86, and 89.6° Fahrenheit).

[Note: The maximum wet bulb globe temperature (WBGTmax) thresholds follow the International Standards Organization criterion for risk of occupational heat illness, whereas the daily maximum heat index (HImax) thresholds follow the U.S. National Weather Service’s definition for an excessive heat warning.] 
Image
This figure shows changes in the number of heat waves per year by frequency, duration, season, and intensity.

SEDAC, one of the Distributed Active Archive Centers (or DAACs) in NASA’s Earth Observing System Data and Information System (EOSDIS), is operated by the Center for International Earth Science Information Network (CIESIN), a unit of the new Columbia Climate School, based at Columbia University’s Lamont campus in Palisades, New York. As part of its mission to synthesize earth science and socioeconomic data and information for policymakers and applied science users, SEDAC archives, manages, and distributes data and provides tools and services that pertain to both the earth and social sciences.

According to Cascade Tuholske, a Postdoctoral Research Scientist hosted by CIESIN, the release of this dataset is significant because it may help decision-makers from a variety of disciplines become more attuned to the dangers at the intersection of extreme heat and population.

“[The UHE-Daily dataset] provides the most accurate record of how both urban extreme heat dynamics have changed in tandem with how urban populations have changed,” said Tuholske. “I think it’s useful for the public health community and the climate community, as well as policymakers, to work together to understand where hotspots are happening and, hopefully, there is something to learn from the people in these communities about how to adapt to and reduce harm from exposure from extreme heat.”

Image
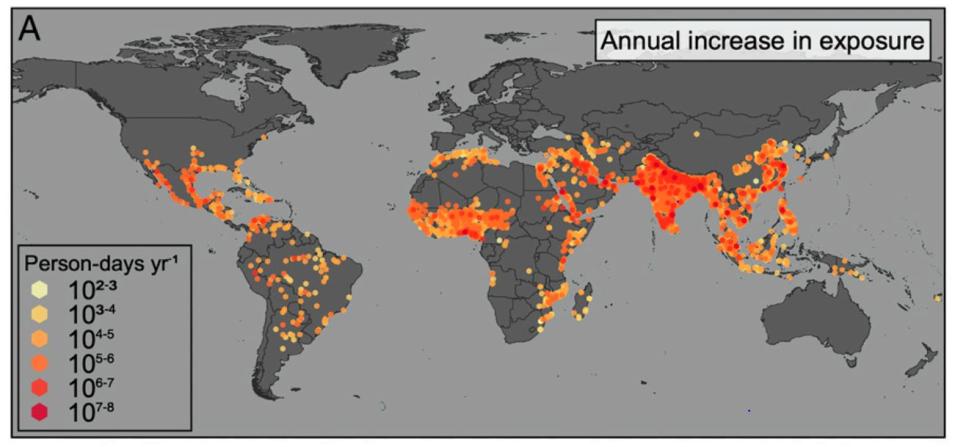
Annual municipality-level increases in the rate of urban population exposure to extreme heat, 1983–2016. Credit: CIESIN

To produce these estimates, Tuholske and his colleagues took Global-Human Settlement Layer Urban Center Database (GHS-UCDB) polygons and converted them to rasters. Daily area-averaged maximum temperatures were calculated for each urban settlement using the Climate Hazards Center CHIRTS-daily dataset and downscaled daily minimum relative humidity estimates were built from CHIRTS-daily data and climate parameters from the European Centre for Medium-Range Weather Forecasts ERA-5 dataset and NASA’s Modern-Era Retrospective analysis for Research and Applications, Version 2 (MERRA-2) climate reanalysis products. Maximum heat index values were generated following the National Oceanic and Atmospheric Administration’s Heat Index procedure and maximum wet bulb globe temperature was estimated using an empirically derived second-order power function with maximum heat index values. To estimate populations for each GHS-UCDB polygon for each year from 1983 to 2016, researchers applied a stepwise linear interpolation to the 1975, 1990, 2000, and 2015 GHS-UCDB population estimates for each urban settlement. Exposure is measured in person-days, or the number of days per year where a threshold is exceeded, multiplied by the urban population exposure. Exposure trends from 1983 to 2016 are determined using an ordinary least linear regression. [Note: complete details regarding the methods used to produce these estimates can be found in the study, “Global Urban Population Exposure to Extreme Heat.”]

Users can download the UHE-Daily dataset from the SEDAC and Earthdata Search websites. The data are available as a .zip file containing both .json and .csv file formats, as well as a .zip file with .shp files. Each .zip file also contains a README.txt file that explains the data variables. In addition, all UHE-Daily records can be mapped with the latitude and longitude of the urban settlement. For more advanced users, the code used to perform the analyses of the UHE-Daily dataset is available on Github.

Using the UHE-Daily dataset, Tuholske and his colleagues from the University of California, Santa Barbara, the University of Minnesota, and the university of Arizona recently published a paper, “Global Urban Population Exposure to Extreme Heat,” in the Proceedings of the National Academy of Sciences (PNAS) that analyzes the combination of this temperature, relative humidity, and population data to provide a comprehensive and nuanced assessment of urban extreme heat exposure for 13,115 cities from 1983 to 2016.

Image
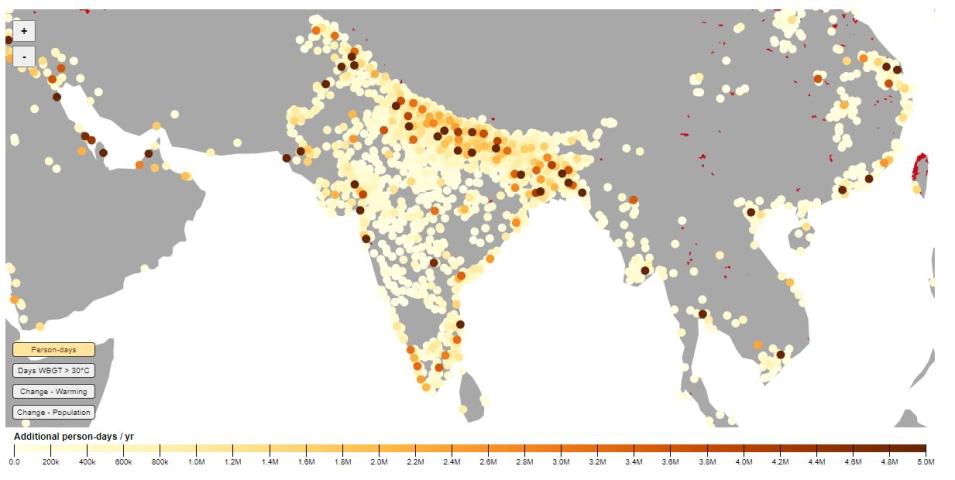
To develop their measure of person-days spent in extreme heat conditions, the researchers matched up the weather data with statistics on the cities’ populations during the same period. Thus, a person-day is equal to the number of days per year where a threshold is exceeded, multiplied by the urban population exposure. Credit: Columbia Climate School

They found that global exposure to extreme heat increased nearly 200% from 1983 to 2016 and that the way in which population growth total urban warming—the increased exposure to extreme heat from both climate change and the urban heat island effect—drove the trajectory of exposures was not evenly distributed.

According to Tuholske and his coauthors, these uneven patterns of exposure highlight an urgent need for local approaches to extreme heat exposure.

“This study reinforces the importance of employing multiple extreme heat exposure metrics to identify local patterns and compare exposure trends across geographies,” the researchers write. “Our results suggest that previous research underestimates extreme heat exposure, highlighting the urgency for targeted adaptations and early warning systems to reduce harm from urban extreme heat exposure.”

As the data reveal, urban population growth accounted for two-thirds of the increases in exposure, while actual warming contributed a third. The cities most affected by population increases tend to be in the low latitudes, closer to the equator. This does not mean that these locations did not experience warming, only that population growth was even more significant. Conversely, the exposure in other cities had more to do with warming than population growth. For example, since the populations of European cities have generally stayed the same, their increases in exposure were driven almost exclusively by increased warmth. In the United States, about 40 sizable cities have seen rapidly growing exposure, mainly clustered in Texas and the Gulf Coast. In many, the causes of the rises have been varying combinations of both increasing population and increasing heat.

Users can get a glimpse of the interplay between extreme heat and population, as well as the uneven heat exposure that Tuholske speaks of, via an interactive map on the Columbia Climate School website. The map allows users to get a global perspective on four global extreme heat parameters: the annual increase in urban populations exposed to extreme heat (i.e., person-days), the annual increase in the number of days with extreme heat, defined as above 30°C on the “wet bulb” scale (i.e., Days WBGT > 30°C), the percent change in exposure due to total urban warming (i.e., Change–Warming), and the percent change in exposure due to urban population growth (i.e., Change-Population).

Although the study by Tuholske et al is not the first to document the dangers of excessive urban heat, it makes an important contribution to the literature on the subject by quantifying, on a granular level, the number of people affected in locations around the world, and the degree to which exposure is being driven by population versus climate.

“There is no other publicly available dataset that tracks how any demographic process and temperature process changed across the planet. We know generally that these things are happening, but they have never been mapped,” said Tuholske. “The second attribute that makes this data truly novel is that, because the dataset is global in nature, we can map cities where these patterns are similar and where they’re diverging. This is a retrospective study—these things have already happened—so I imagine that many of the people in those cities have adapted and I think there is a lot of opportunity for a bottom-up transfer of knowledge.”

Given that heat waves around the globe have become more frequent, long lasting, and intense, and that the number of days people are experiencing extreme heat is on the rise around the globe, it seems this new SEDAC dataset and the insights it offers have arrived right on time.

Last Updated