Nighttime Lights

Backgrounder on VIIRS day/night band and its applications.
Image
Global view of Earth's city lights from a composite assembled from Day/Night data acquired by the Suomi National Polar-orbiting Partnership (Suomi NPP) satellite. The data were acquired over nine days in April 2012 and 13 days in October 2012. NASA Earth Observatory image.

Between now and 2050, the world’s urban population is expected to grow by 2.5 billion, an addition of about 170,000 people a day, according to estimates by the United Nations. This is equal to adding a city the size of Providence, Rhode Island, every day for the next 41 years. A majority of this growth will occur in developing countries. As Earth’s population continues to grow, remote sensing data offer a view from space of human behaviors, whether from changing the landscape through deforestation and urbanization or modifying air quality through increases in pollutants.

Remote sensing of nighttime light emissions offers a unique perspective for investigations into some of these human behaviors. The Visible Infrared Imaging Radiometer Suite (VIIRS) instruments aboard the joint NASA/NOAA Suomi National Polar-orbiting Partnership (Suomi NPP) and NOAA-20 satellites provide global daily measurements of nocturnal visible and near-infrared (NIR) light that are suitable for Earth system science and applications studies. VIIRS Day/Night Band (DNB) data are used for estimating population, assessing electrification of remote areas, monitoring disasters and conflict, and understanding biological impacts of increased light pollution.

This Nighttime Lights (NTL) Backgrounder provides information about how these data are collected, examples showing how these data are used, and direct links for accessing NTL datasets.

Sensing NTL

Viewing nighttime lights provides a unique perspective of the planet. Unlike daytime remote sensing, there are multiple sources of nighttime illumination. These sources include moonlight, light directly emitted by a source (e.g., buildings and transport), and light reflected by the ground, also known as surface albedo. Snow, which has a high surface albedo under illuminated conditions, can increase the signal returned to a satellite-borne instrument at 512 miles. On the other hand, natural land surfaces with a low surface albedo, such as water bodies and forest canopies, reflect far less light.

NTL data have a long time series. The U.S. Department of Defense launched the Defense Meteorological Satellite Program (DMSP), a series of sun-synchronous satellites, to collect nighttime light emissions with the Operational Linescan System (OLS) sensor from the early 1970s until 2011. The digital stream of data, however, did not begin until 1992.

While DMSP OLS provided long-term data to map urban extent, OLS data have several disadvantages:

  • The 2.7 km spatial resolution is coarse.
  • The radiometric resolution is 6 bits, resulting in saturated pixel values in urban centers and weak detection of small urban settlements.
  • Given the lack of on-board calibration, radiometric quantities are not consistent across space or time. This inconsistency can cause issues when analyzing time series.

In 2011, through a partnership with NOAA and the Department of Defense, NASA launched the Suomi NPP satellite and in 2018 the NOAA-20 satellite. Both satellites carry the VIIRS instrument, which also collects NTL emissions and continues the long-term NTL data record. The VIIRS DNB improves upon the older DMSP OLS with higher spatial and radiometric resolution: VIIRS has a spatial resolution of 375 and 750 meters (depending on the band), daily temporal resolution, and more complete global coverage and higher quality data.

For more information on resolutions, see the Earthdata backgrounder What is Remote Sensing?

Image
Comparison of nighttime light products from the Defense Meteorological Satellite Program (DMSP) Operational Linescan System (OLS) sensor and the joint NASA/NOAA Suomi National Polar-orbiting Partnership (Suomi NPP) Visible Infrared Imaging Radiometer Suite (VIIRS) instrument. Images were acquired November 2012 over Delhi, India. NASA Earth Observatory image.
Image
Spectral response of popular sensors and spectra. Wavelengths visible to humans generally range from 380 to 750 nanometers (nm). From top to bottom: (a) the blue, green, and red spectral response of the Nikon D3s cameras used by astronauts aboard the International Space Station; (b) a typical response of a metal halide lamp, popular on architectural lights; (c) spectral response of a high pressure sodium (HPS) light, popular until 2014 on street lighting; (d) spectral response of light-emitting diodes (LEDs) of 5000K (blue line), 4000K (cyan line), 2700K (grey line), and PC-Amber (amber line), popular on street lighting; (e) representative spectral response of DMSP/OLS (black line) and Suomi NPP/VIIRS DNB (blue line). Credit: Levin, et al., 2020 (doi:10.1016/j.rse.2019.111443).

VIIRS DNB operates in the visible to near-infrared portion of the spectrum: 400-900 nanometers (nm). This spectral range is ideal for exploring NTL as many human-made light sources provide spectral responses in this range. For example, metal halide lamps, popular on architectural lights, have an increased response at around 550 and 600 nm, and light-emitting diode (LED) lights, which are popular in street lighting, have a spectral signal within this range.

The VIIRS Level 1 DNB product has been calibrated, but stray light and other sources of noise (e.g., lunar illuminance, twilight, clouds, noisy scan-edges, etc.) affect the DNB quality, and warrant additional correction. For example, with moonlight the reflectance of snow cover, smoke, airborne dust, sea ice, and land surface features are visible. Likewise, artificial light sources exhibit large variations when viewed at different satellite viewing geometries. This requires that the data be carefully processed so scientific analyzes and applications are conducted consistently.

To enable the use of NTL data for scientific investigations, NASA developed a series of products known as the Black Marble. NASA’s Black Marble product suite for Suomi NPP (VNP46) improves NTL data in several ways:

  • Atmospheric correction - The VNP46 algorithm corrects aerosols, water vapor, and ozone impacts on nighttime lights radiances.
  • Bidirectional Reflectance Distribution Function (BRDF) - The VNP46 algorithm estimates and removes moonlight contribution based on surface BRDF/albedo.
  • Angular Correction - The VNP46 algorithm accounts for variations in artificial light sources by conducting consistency checks as a function of satellite view and illumination geometry.

The Black Marble product suite includes daily at-sensor Top of Atmosphere (TOA) nighttime radiances (VNP46A1), including all necessary ancillary data (e.g., nighttime cloud, snow mask, and view-illumination angles), as well as daily moonlight-adjusted NTL with corresponding quality flags (VNP46A2).

NASA’s Black Marble monthly (VNP46A3) and yearly (VNP46A4) NTL composites are generated from daily atmospherically- and lunar-BRDF-corrected NTL radiance (VNP46A2) to remove the influence of extraneous artifacts and biases. Artificial lights show a strong angular effect. The presence of nighttime snow also enhances the scattering of reflected NTL due to the increased surface reflectance. Accordingly, these products are generated for multiple view-angle categories (i.e., near-nadir, off-nadir, and all angles) and snow status (snow-covered and snow-free) along with ancillary metrics of standard deviation, the number of observations, and mandatory quality assurance flags.

Choosing the Right Black Marble Product

Since lunar effects have not been removed from the VNP46A1 NTL product, sky-illumination and environmental conditions can impact imagery. For detecting changes in human activities and processes linked to artificial lights at night, the VNP46A2 product, which "turns off the moon," is a better choice.

Image

It’s important to understand which NTL are captured by VIIRS DNB and which NTL are not (e.g., outdoor lights, building lights, traffic, etc.). Understanding the composition of the sources making up NTL signals enables better use of the data in Earth system science and urban applications.

References:

Back to Top

Applications of NTL
Image
Hurricane Maria made landfall in Puerto Rico on September 20, 2017, causing power outages across the island. Black Marble data was used to assess the extent of outages and prioritize areas for recovery. Full power was not restored until 18 months after the event. Interactively explore this image and compare VIIRS DNB imagery using NASA Worldview. NASA Worldview image.

NTL contribute to a variety of Earth science studies and applications. By "subtracting" moonlight and other extraneous sources, researchers can systematically monitor artificial lights like street and building lighting, fishing boats, gas flares, fires, aurora, and many human activities. In addition, Black Marble data are helping assess progress towards meeting many of the United Nation's Sustainable Development Goals (SDGs), specifically addressing the needs of conflict-affected populations (SDG-1); quantifying the effectiveness of local electrification projects in the developing world (SDG-7); building infrastructure resilient to disasters, promoting inclusive and sustainable industrialization, and fostering innovation (SDG-9); and ensuring that cities and human settlements are inclusive, safe, resilient, and sustainable (SDG-11). Below are three use cases that are changing the way we "see" our world, at all hours. For additional information and datasets for monitoring SDGs, see the Earthdata SDG Data Pathfinders.

Disaster Impacts and Recovery

Disasters affect millions of people every year. Often, these events are followed by power outages and blackouts. The high spatial resolution and the daily temporal resolution of VIIRS DNB images provide information on where outages are located and the progressive restoration of the electric grid. Furthermore, acquiring such data via remote sensing does not impede collecting them over areas impacted by damage, debris, or accessibility issues.

Hurricane Maria swept across the Caribbean in September 2017, devastating many islands. In Puerto Rico, the hurricane caused power outages across the island. This disaster was the first time nighttime lights data were routinely used by emergency management agencies to aid in disaster mitigation and recovery efforts. The near real-time data informed federal and local government authorities, construction and utility crews, and relief organizations so that they could visualize the extent of outages and prioritize areas for recovery.

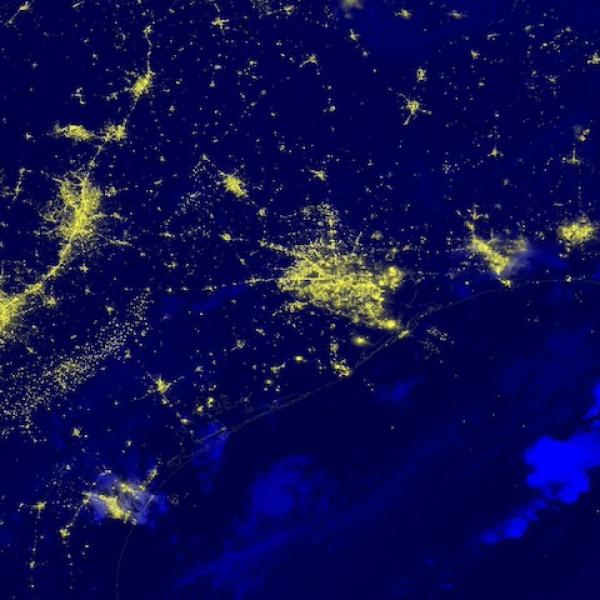
Houston, TX, experienced a major winter storm in February 2021, which shattered low-temperature records and knocked out power to 1.4 million customers. Natural gas shortages were already impacting demand, which only intensified as time progressed. Controlled outages and downed power lines left parts of the state in the dark. NASA Black Marble data show the extent of this outage event. The image below is a Black Marble High Definition (HD) product. Black Marble HD is generated through the synergistic use of the daily NASA Black Marble standard product with data from other Earth observing satellites (e.g., Landsat 8, Sentinel-2) and ancillary data sources (e.g., street, building, and other GIS layers).

Image
This VIIRS nighttime lights image shows power outages across Houston caused by extreme cold combined with several snow and ice storms in February 2021. Interactively explore imagery comparing the differences in nighttime lights in Houston on Feb. 7 and Feb. 16. NASA Earth Observatory image.

For more datasets used in monitoring disasters and assessing impacts, see the Disasters Data Pathfinder series.

Additional disaster use case stories:

Biological Impacts

Image
Map showing where electric light pollution in Chicago is likely to have the largest effect on wildlife. Purple colors indicate locations having light levels of at least 6 lux, which is the minimum light level where researchers observed behavior changes. NASA Earth Observatory image.

As population grows and urbanization increases, cities and humans encroach on natural environments. Wildlife in or close to these urban centers face new stressors that can have behavioral and ecological effects, one of those being artificial NTL. For wildlife, light influences navigation, activity, and reproduction. For example, turtle hatchlings follow the brightest light source, which naturally is moonlight reflected off the ocean surface; artificial lights can cause disorientation and prevent their movement toward the ocean, often resulting in mortality. In addition, a study by researchers at Northeastern Illinois University using International Space Station nighttime photography images found that increases in artificial light led to behavioral changes in nocturnal animals, causing them to become less active and roam less.

Other well-documented effects include temporal niche partitioning (i.e., when competing species use the environment at different time frames to help them coexist); altered repair and recovery of physiological function (e.g., NTL may influence the release of melatonin in certain species of perch and roach); interference with detection of predators and environmental resources, signaling, and camouflage; changes in reproductive behavior; and alterations in circadian rhythms. In a study published by The Royal Society, researchers looked at predator-prey interactions between pea aphids and two species of ladybugs. They found that for those species of ladybugs that foraged effectively in darkness, light pollution did not change the suppression of aphids; for more visual predators, however, light pollution aided their predation, leading to much lower aphid abundances.

While most research exploring the impacts of NTL on ecological systems has focused on terrestrial environments, there are several studies of aquatic environments. Most of the studies have focused on coastal and offshore fishing activities. The improving spatial resolution of nighttime images facilitates more studies in aquatic environments. In a study published in WIREs Water, researchers investigated the knowledge gaps of using ground-based and remote sensing data to assess the impacts of artificial lighting on aquatic and riparian ecosystems.

For more datasets used in monitoring biological diversity, see the Earthdata Biological Diversity and Ecological Forecasting Data Pathfinder series.

Additional biological use case stories:

Using NTL in Social, Economic, and Cultural Studies

NTL data provide insight into the social, economic, and cultural patterns and behaviors within urban environments, from electrification, conflict-induced migration, holidays, and more. In a recent investigation, a research team used Black Marble products to illustrate different types of changes in social, economic, and cultural behaviors depicted in NTL patterns between 2012 and 2020.

Image
Changes in NTL patterns in global sample cities between 2012 and 2020. These data were generated using the operational Black Marble monthly composite product (VNP46A3) with the latest available data. Credit: Levin, et al., 2020 (doi:10.1016/j.rse.2019.111443).

The figure at the right shows changes in NTL patterns in global sample cities over time using the Black Marble monthly composite product (VNP46A3). In Aleppo, Syria, the impact of conflict and population displacement that began in early 2013 is seen as a dramatic decrease in nighttime lights (top graph). In the El Zaatari refugee camp in Jordan, an influx of refugees from Syria during this time made the camp one of the largest in Jordan, with a corresponding increase in nighttime lights (second graph).

As Dubai, UAE, expanded to became a global Middle East business hub, this also led to an increase in nighttime lights from increased road networks and industrial units (third graph). While the steady increase in Dubai's nighttime lights pattern over the decade suggests a growing economy in the country, we can also see impacts on economic activities due to lockdowns and business closures during the COVID-19 pandemic with the dip in the pattern starting in 2020.

A sudden dip in the nighttime lights pattern of San Juan, Puerto Rico, in 2017 reflects the devastating impact of Hurricane Maria (September 2017), which led to extended power outages throughout the island (fourth graph). A steady decrease in nightlight in the capital city of Caracas, Venezuela, shows evidence of the country's economic recession which began in 2014 and led to a continuing decrease in its gross domestic product (GDP) (fifth graph). Finally, a seasonal pattern commonly attributed to seasonal vegetation cycles is evident in the nighttime lights pattern in Juliaca, Peru (bottom graph).

Additional socioeconomic and cultural use case stories:

References:

Jechow, A. & Hö lker, F. (2019). “How dark is a river? Artificial light at night in aquatic systems and the need for comprehensive night-time light measurements.” WIREs Water, 6 (6) [doi:10.1002/wat2.1388].

Levin, N., Kyba, C.C.M., Zhang, Q., Sánchez de Miguel, A., Román, M.O., Li, X., Portnov, B.A., Molthan, A.L., Jechow, A., Miller, S.D., Wang, Z., Shrestha, R.M. & Elvidge, C.D. (2020). “Remote sensing of night lights: A review and an outlook for the future.” Remote Sensing of Environment, 237(111443) [doi:10.1016/j.rse.2019.111443].

Miller, C.R., Brandon, B.T., Zhu, L., Radeloff V.C., Oliver, K.M., Harmon, J.P. & Ives, A.R. (2017). “Combined effects of night warming and light pollution on predator-prey interactions.” Proceedings of the Royal Society B., 284 (20171195) [doi:10.1098/rspb.2017.1195].

Min, B., Mensan Gaba, K., Sarr, O.F. & Agalassou, A. (2013). "Detection of rural electrification in Africa using DMSP-OLS night lights imagery." International Journal of Remote Sensing, 34(22), 8118-8141 [doi:10.1080/01431161.2013.833358].

Román, M.O. & Stokes, E.C. (2015). “Holidays in lights: Tracking cultural patterns in demand for energy services.” Earth's Future, 3 (6), 182-205 [doi:10.1002/2014EF000285].

Román M.O., Stokes E.C., Shrestha R., Wang Z., Schultz L., Carlo E.A.S., et al. (2019). “Satellite-based assessment of electricity restoration efforts in Puerto Rico after Hurricane Maria.” PLoS ONE, 14(6):e0218883 [doi:10.1371/journal.pone.0218883].

Schirmer, A.E., Gallemore, C., Liu, T., Magle, S., DiNello, E., Ahmed, H. & Gilday, T. (2019). “Mapping behaviorally relevant light pollution levels to improve urban habitat planning.” Scientific Reports, 9 (11925) [doi:10.1038/s41598-019-48118-z].

Stokes, E.C., Román, M.O., Wang, Z., Shrestha, R.M., Yao, T. & Kalb, V. (2019). “Urban Applications of NASA’s Black Marble Product Suite.” Joint Urban Remote Sensing Event (JURSE), 1-4 [doi:10.1109/JURSE.2019.8809074].

Stokes, E.C. & Seto, K. (2019). “Characterizing urban infrastructural transitions for the Sustainable Development Goals using multi-temporal land, population, and nighttime light data.” Remote Sensing of Environment, 234 (111430) [doi:10.1016/j.rse.2019.111430].

Wang, Z., Román, M., Sun, Q., Molthan, A. & Kalb, V. (2018). “Monitoring Disaster-related Power Outages Using NASA Black Marble Nighttime Light Product.” The International Archives of the Photogrammetry, Remote Sensing and Spatial Information Sciences, XLII-3, 1853–1856 [doi:10.5194/isprs-archives-XLII-3-1853-2018].

Back to Top

Find NTL Data

The VIIRS DNB NTL image layer shows Earth’s surface and atmosphere using a sensor designed to capture low-light emission sources under varying illumination conditions.

Image
Black Marble Nighttime Blue/Yellow Composite showing the Nile River Delta on May 7, 2021. The Blue/Yellow Composite is a false color image created using the VIIRS at-sensor radiance and brightness temperatures from the M15 band. Interactively explore this image using NASA Worldview. NASA Worldview image.

NASA has developed the Black Marble, a daily calibrated, corrected, and validated product suite that enables effective use of NTL data for scientific observations. Black Marble's standard science processing removes cloud-contaminated pixels and corrects for atmospheric, terrain, vegetation, snow, lunar, and stray light effects on VIIRS DNB radiances. Black Marble data products are available at LAADS DAAC. Black Marble also provides a Nighttime Blue/Yellow Composite which is a false color composite created using the VIIRS at-sensor radiance and brightness temperatures from the M15 band. This color combination is especially useful for first responders, enhancing their ability to detect power outages.

Users can visualize and acquire NTL images through NASA's Global Imagery Browse Services (GIBS). The GIS Data Pathfinder's geospatial services section provides information for the GIBS web map service (WMS).

Image
Screenshot showing how to add VIIRS Day Night Band At Sensor Radiance into QGIS via the GIBS WMS. NASA image.

The LAADS DAAC offers a Black Marble HDF to GeoTIFF Converter tool, which is a Python script to read, convert (GeoTIFF), and display Black Marble files (if running within a GIS python console). See the Tools section for more information on using this tool.

To learn more about Black Marble data and applications, see the NASA Applied Remote Sensing Training (ARSET) program: Introduction to NASA's "Black Marble" Night Lights Data.

Back to Top

Tools

The HDF to GeoTIFF tool available through the Black Marble website is a Python script which can be run through a standard Python console or through the Python console of a GIS platform, like ArcGIS or QGIS. You must specify the input and output folders for the Black Marble VPN46 files. The current script only reads the first file (if there are multiple files in the input folder). Also, it’s important to note that the program calls files alphabetically. Hidden files, such as ".DS_Store" on a Mac, are invoked first and return an error. You can use the following code to iterate through the HDF5 files, if needed:

  1. Replace ##Open HDF File with the following:
    ## Open HDF file
    path, dirs, files = next(os.walk("C:\\InputFolder\\"))
    file_count = len(files)
    x = 0
    while x < file_count:
  2. Insert remaining code under the while statement
  3. Add the following (also under the while statement):
    print(files[x])
    x += 1

LAADS Web Tutorials provide mechanisms for searching, accessing, and acquiring data available through LAADS DAAC.

COVID-19 Dashboard

NASA’s COVID-19 dashboard features data collected and analyzed by NASA. Information about Earth systems is gathered by a constellation of global Earth-observing satellites, instruments aboard the International Space Station, airborne science campaigns, and through ground observations. These datasets help monitor, track, and compare COVID-19-driven changes to Earth systems over time.

The dashboard contains information on how researchers are using nighttime light observations to track variations in energy use, migration, and transportation in response to social distancing and lockdown measures.

Image