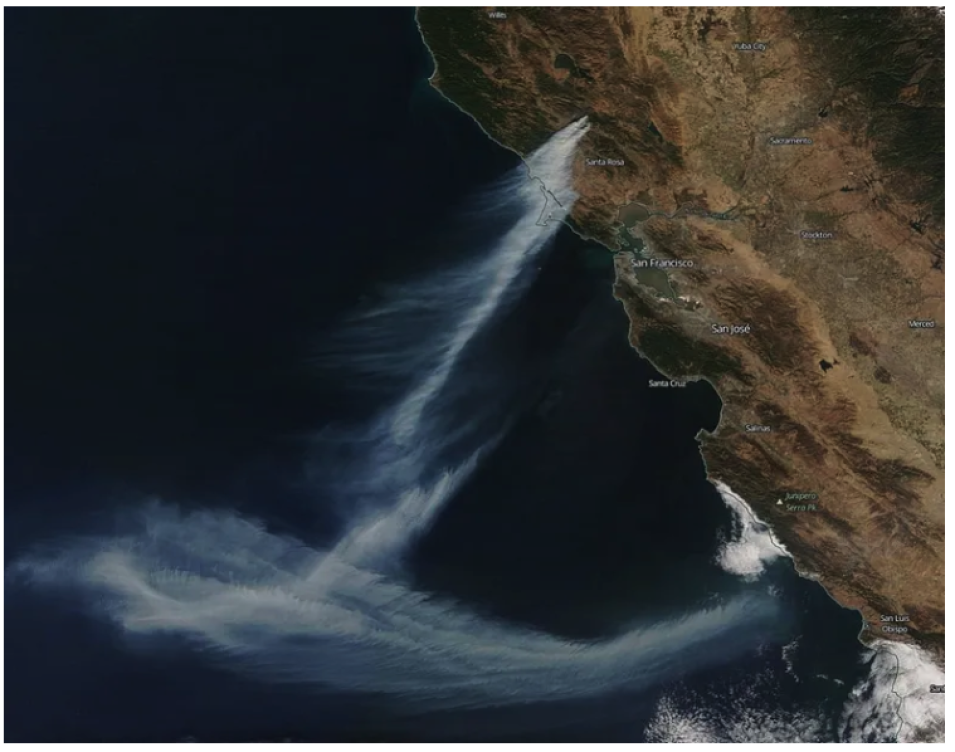
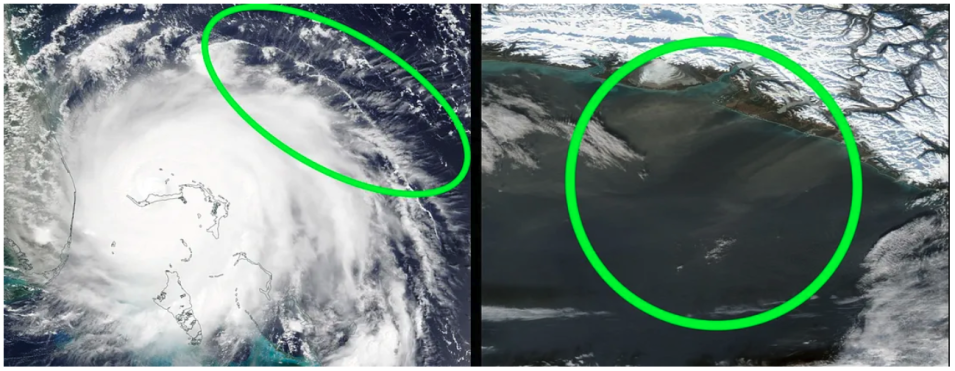
We are all familiar with images of the Earth from space, most often taken by instruments on satellite platforms. Thousands of images are collected every day from satellite instruments. The data are most valuable to researchers and applied scientists when quickly processed to identify the distinct and desired meteorological phenomena under study. The task of identifying images falls to Earth science subject matter experts; however, sifting through the immense volume of images can be daunting.
Phenomena Detection Portal
To facilitate this task, NASA's Interagency Implementation and Advanced Concepts Team (IMPACT) machine learning team is developing the Phenomena Detection Portal, a web tool that utilizes machine learning techniques to detect and catalog atmospheric phenomena such as smoke plumes, high latitude dust events, and transverse cirrus bands in Earth science images. These phenomena are of interest to the Earth science community.
While the Phenomena Detection Portal is first and foremost a scientific research tool, Dr. Brian Freitag points out that it has the potential to engage a wider segment of users beyond those working in Earth science research:
"The visualization component of the Phenomena Detection Portal would likely be of most interest outside of the research community. Detections from the portal include images used for classification which provides a better understanding of what these phenomena look like in satellite imagery."
While the visualization and quick analysis components of the Phenomena Detection Portal are the visible features, the most significant contribution to the Earth science community is the generation of Earth science phenomena-specific event databases. The automated detection of specific meteorological phenomena provides a robust, dynamic event database that researchers in the Earth science community can use to perform detailed case studies or climatologies for a phenomenon of interest. A big value add for Earth scientists is that as Earth science data volume grows and migrates to the cloud, the event databases generated by the Phenomena Detection Portal’s machine learning models make it easier to use these large datasets.
Imagery from the Geostationary Environmental Operational Satellite (GOES) Advanced Baseline Imager (ABI) and the Moderate Resolution Imaging Spectroradiometer (MODIS) instruments is used to train the machine learning models that feed the Phenomena Detection Portal. Anywhere from several hundred to several thousand images are used as input to train the detection models. For pixel-level detection models such as the smoke and high latitude dust models, subject matter experts create or modify polygons outlining the smoke and dust plumes. For example, initial smoke plume outlines are provided by the National Oceanic Atmospheric Association (NOAA) Hazard Mapping System (HMS) fire and smoke product and are then modified to align the smoke plume to the time of the GOES ABI image.
The Phenomena Detection Portal uses Amazon Web Services (AWS) cloud technologies to auto-scale capacity with user demand. The models are trained in-house and deployed in AWS S3 buckets. The detected phenomena are listed and stored in an AWS relational database for that event topic (i.e. smoke, high latitude dust, transverse cirrus bands). The resulting databases can be accessed using application program interface (API) gateways. The API is utilized by the tool for visualization of detections and is also publicly available to users to extract identified feature information.
Muthukumaran Ramasubramanian explains the contribution the Phenomena Detection Portal is making to scientific research as part of IMPACT’s larger machine learning strategy:
"It is a real-world example of the pipeline we at IMPACT are building to tackle Earth science-based problems using machine learning. It also exemplifies how using cloud services can accelerate scientific research.To our knowledge, this is the first time a pipeline like this has been released in a production environment."
Currently, the Phenomena Detection Portal incorporates output from three machine learning models trained for specific atmospheric phenomena: 1) high latitude dust, 2) smoke, 3) transverse cirrus bands. An alpha release of the Phenomena Detection Portal is available at the link directly below.
Learn more about the Phenomenon Detection Portal.
View LinkedIn profiles for Brian and Muthukumaran.
[1] J. Miller et al., “Detection of transverse cirrus bands in satellite imagery using deep learning,” Computers and Geosciences, vol. 118, pp. 79–85, 2018.


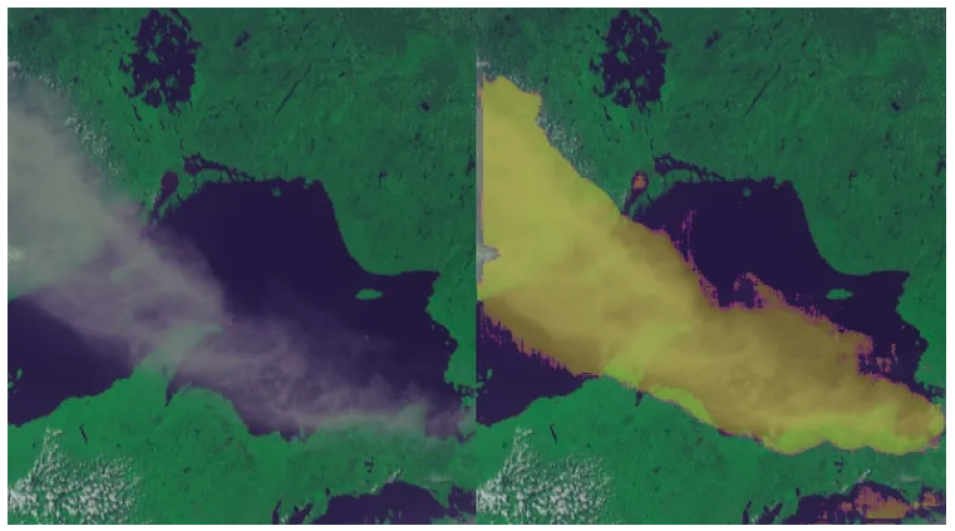
![Class activation map (CAM) (right) for an image with transverse cirrus bands (TCB) (left). The heat-map predicts important features of TCB. CAM is a visualization technique used to highlight discriminating features used to identify the object of interest. [1] Comparison of satellite data images showing cirrus bands and AI generated class activation map.](https://earthdata.nasa.gov/s3fs-public/styles/hds_large/public/2023-11/impact_phenomena_4_blog.png?VersionId=DYpjb73pDg6LFYdqQuUEOijCugxk4qSR&itok=Y3nmQg6l)