Introduction

Wildfires that strike heavily-populated areas often get significant media coverage along with the increases in budgets and resources needed to contain them. But what can be done to monitor and fight wildfires raging in the more remote parts of the world?

On Sept. 8, 2019, a lightning strike sparked a fire that smoldered on the southern slopes of Colorado’s Sangre de Cristo Mountains near the city of Salida. Firefighters worked to steer the slowly-spreading fire, dubbed the Decker Fire due to its proximity to Decker Creek, away from the few homes and structures in the area. It did not pose a substantial threat to the general public, so land managers let it remain largely uncontained to allow it to clear out dead and dry vegetation.

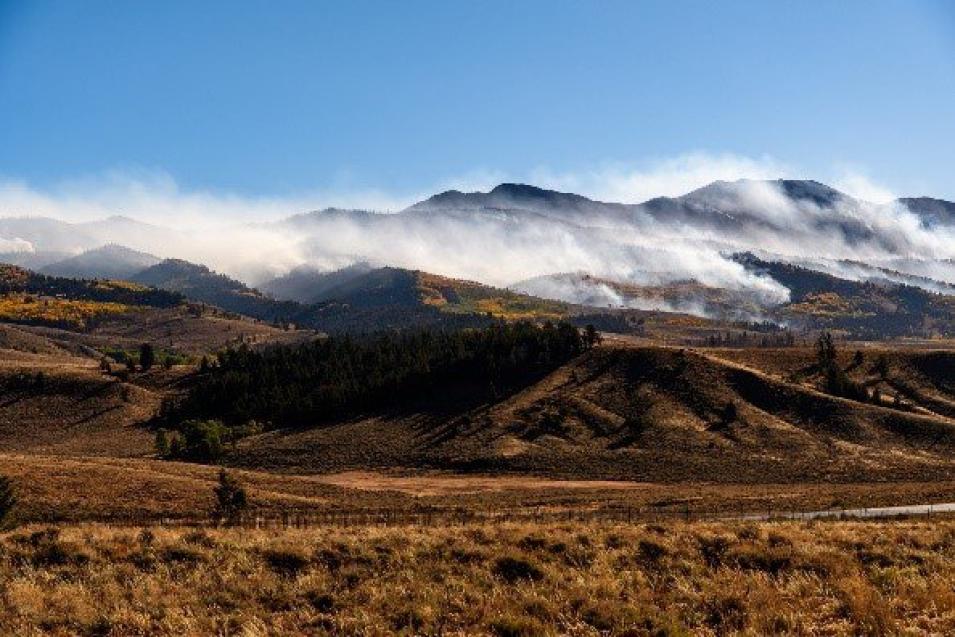
However, on October 1, low humidity and wind gusts created fire conditions that pushed the blaze to the north side of the ridge, closer to Salida. This direct threat to the city mobilized authorities to aggressively combat the fire with fire breaks and aerial water drops that controlled the direction and intensity of the fire. At its greatest extent, the Decker Fire burned over 36 square kilometers (9,000 acres) of the Rio Grande and San Isabel National Forests. Six weeks of concentrated efforts were able to get the fire 75% contained, with an estimated full containment date of December 20. However, the solution to natural disasters can sometimes be found within nature itself. A heavy snowfall on October 23 doused the last remnants of the Decker Fire.
Image
Image Caption

The Decker Fire burning in the mountains near Salida, Colorado, on Oct. 3, 2019. Credit: BFS MAN / flickr / CC BY-NC 2.0.

Science Objectives

First responders and civic officials can utilize thermal anomalies and fire products from lower-resolution remote sensing instruments, such as the Suomi National Polar-orbiting Partnership (Suomi NPP) Visible Infrared Imaging Radiometer Suite (VIIRS), to monitor how a fire is evolving. 

Major Findings

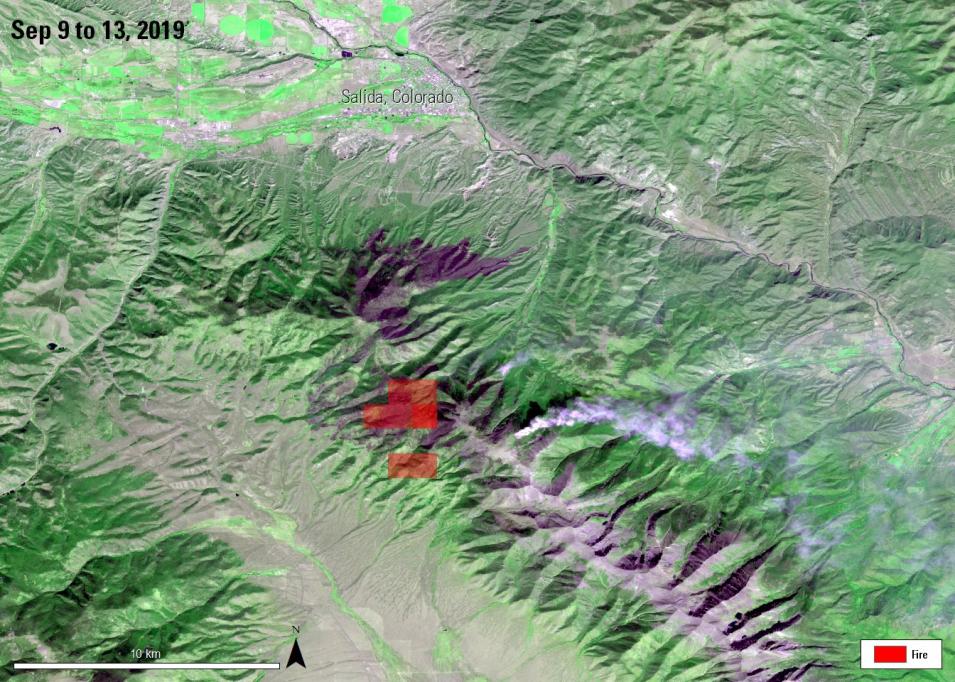
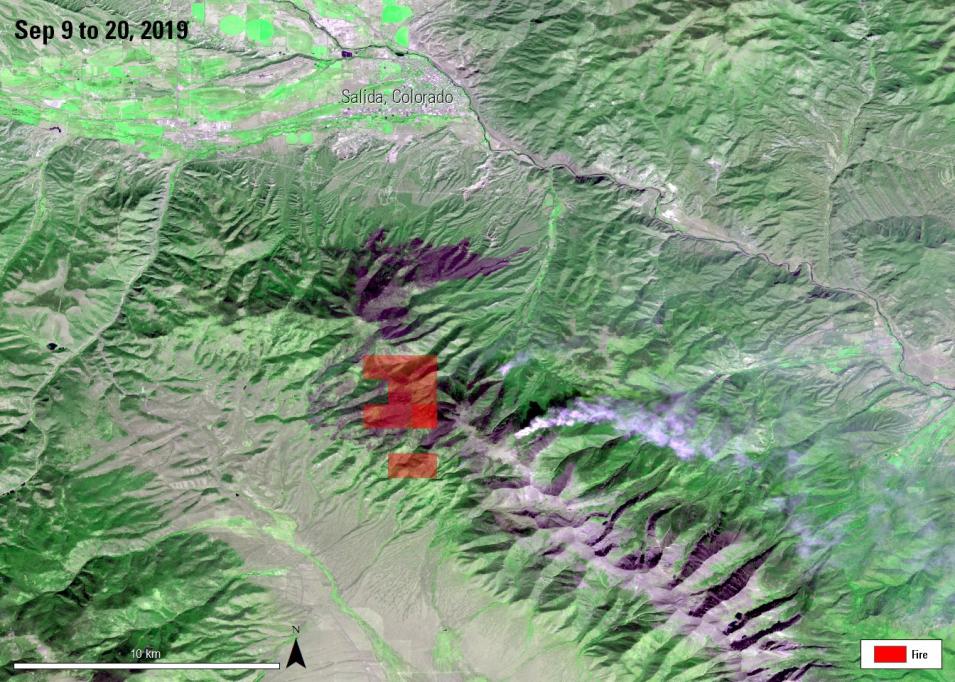
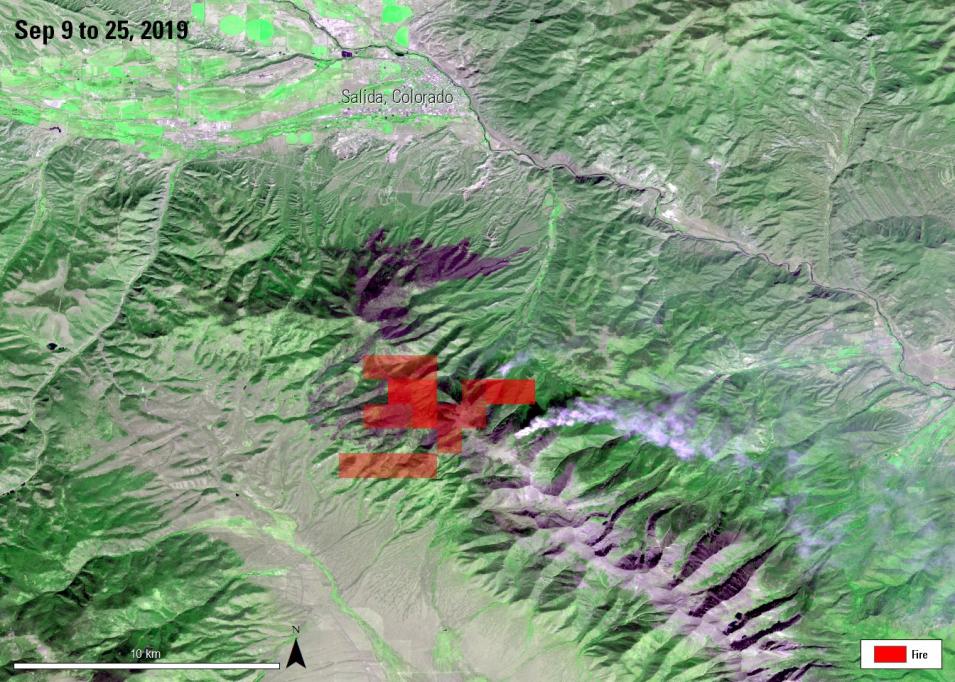
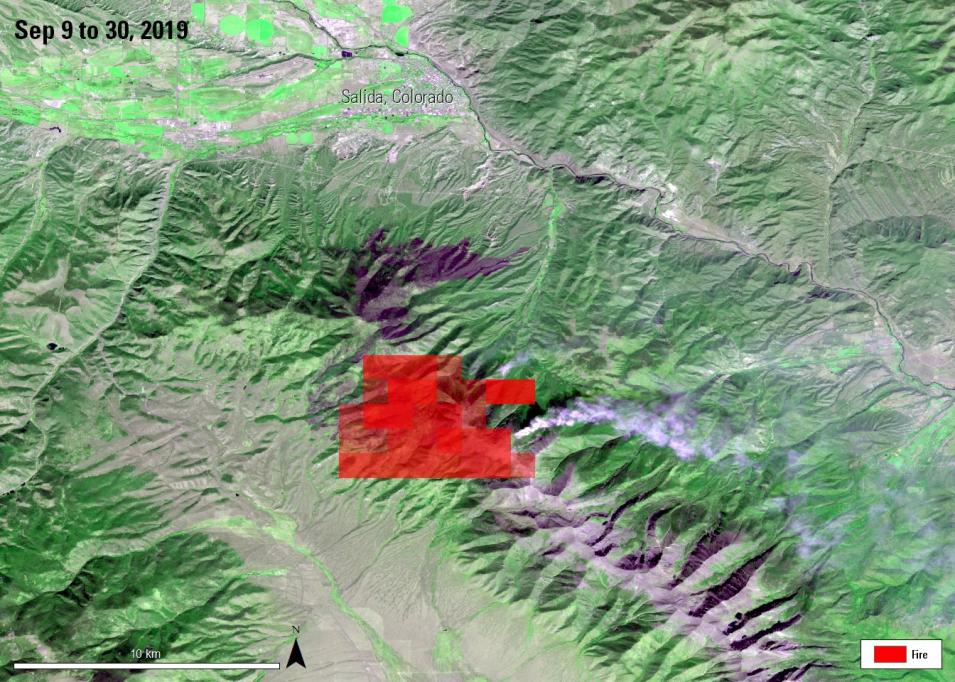
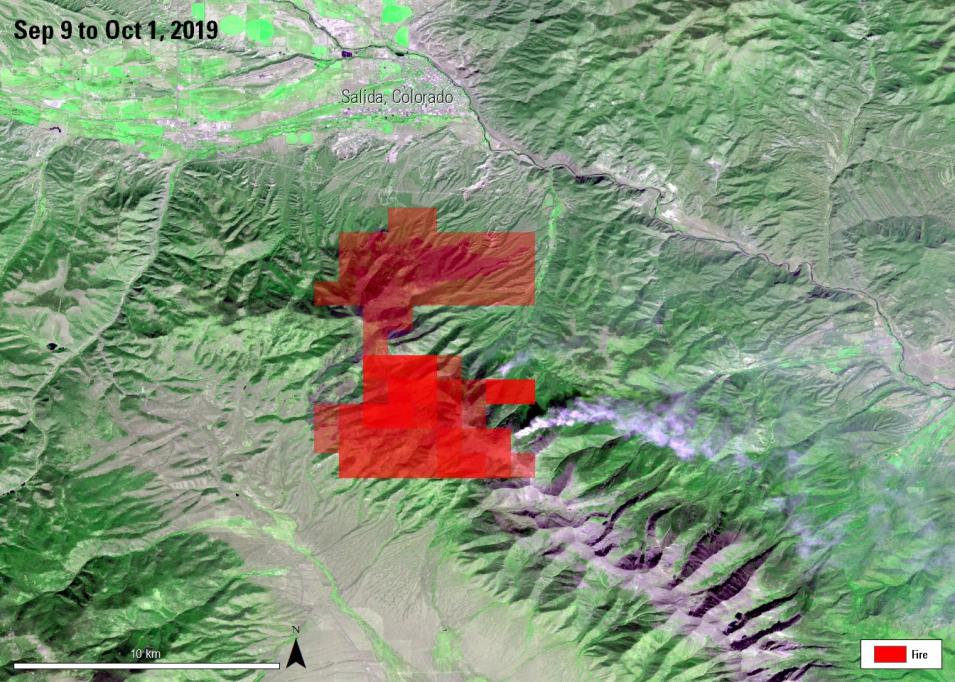
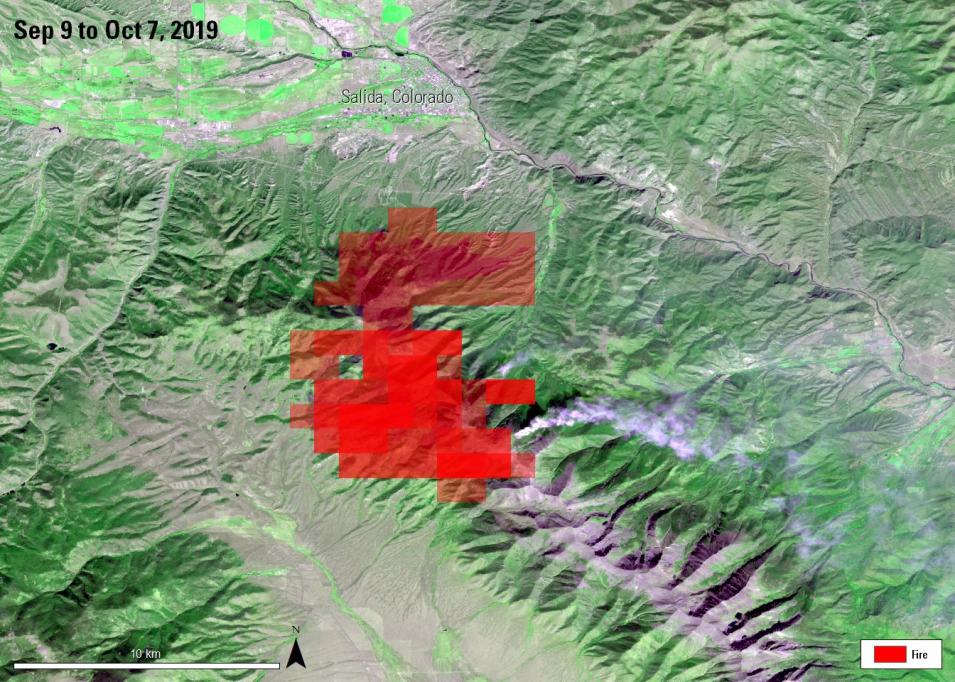
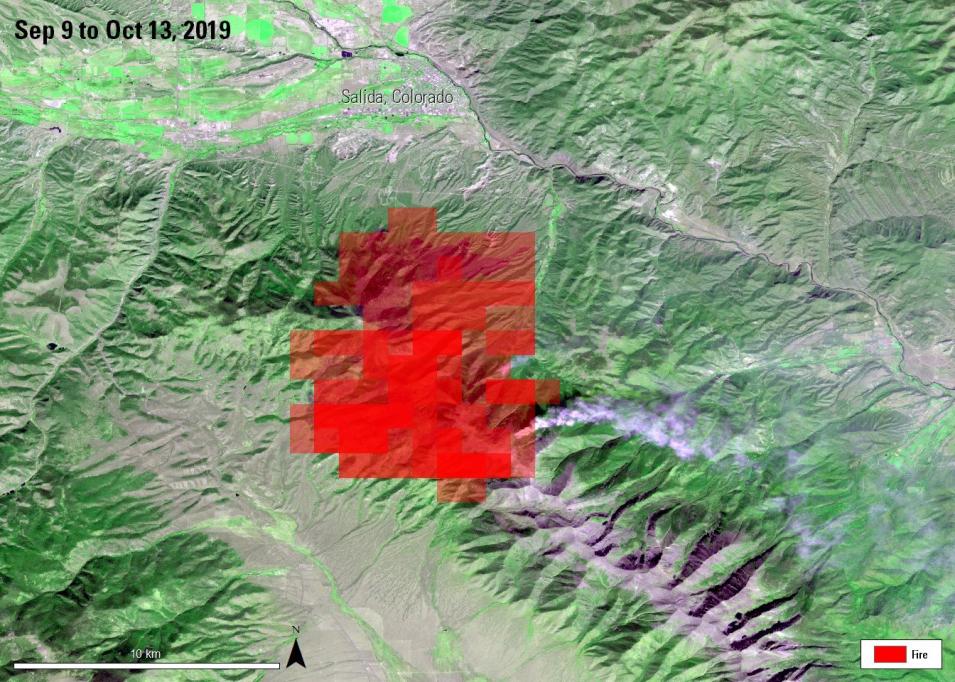
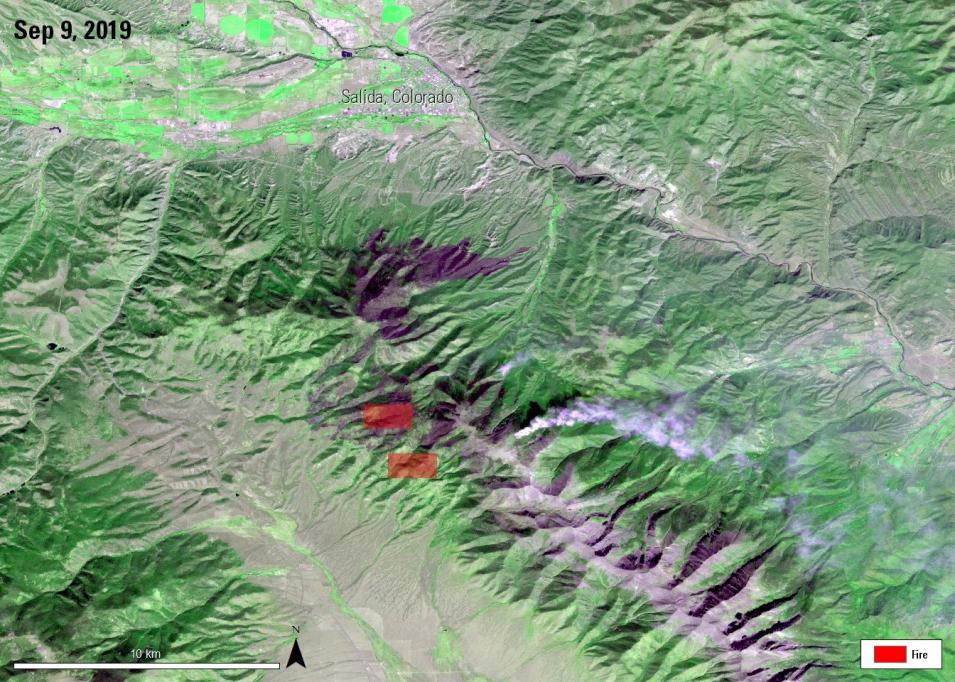
For large events such as the Decker Fire, the accuracy of the daily Suomi NPP NASA VIIRS Thermal Anomalies/Fire (VNP14A1) 1-km product can be shown in the time series below. This time series follows the various flare-ups detected by Suomi NPP NASA VIIRS, indicated by the red pixels. Deeper red colors specify areas under a longer and more pronounced burn. The underlying image was acquired from the higher-resolution Advanced Spaceborne Thermal Emission and Reflection Radiometer (ASTER) Precision Terrain Corrected (AST_L1T) product on October 12. Burn scars in the ASTER image can clearly be seen in the corresponding regions of the VIIRS data, and several fires and smoke plumes are identifiable on the eastern edge of the ridge.

Image
Image Caption

Suomi NPP NASA VIIRS Thermal Anomalies and Fire data (red) of the Decker Fire from September 9 overlaid on Terra ASTER Precision Terrain Corrected data of the Decker Fire from October 12. This image shows where the Decker Fire originated.

Image
Image Caption

Suomi NPP NASA VIIRS Thermal Anomalies and Fire data (red) of the Decker Fire from September 13 overlaid on Terra ASTER Precision Terrain Corrected data of the Decker Fire from October 12. This image shows the slow growth of the Decker Fire over the first week of its existence.

Image
Image Caption

Suomi NPP NASA VIIRS Thermal Anomalies and Fire data (red) of the Decker Fire from September 20 overlaid on Terra ASTER Precision Terrain Corrected data of the Decker Fire from October 12. This image shows the continued steady growth of the Decker Fire in a localized area.

Image
Image Caption

Suomi NPP NASA VIIRS Thermal Anomalies and Fire data (red) of the Decker Fire from September 25 overlaid on Terra ASTER Precision Terrain Corrected data of the Decker Fire from October 12. This image shows the Decker Fire expanding to the south and east.

Image
Image Caption

Suomi NPP NASA VIIRS Thermal Anomalies and Fire data (red) of the Decker Fire from September 30 overlaid on Terra ASTER Precision Terrain Corrected data of the Decker Fire from October 12. This image shows a very large area of the southern slope of the mountain ridge impacted by the expansion of the Decker Fire.

Image
Image Caption

Suomi NPP NASA VIIRS Thermal Anomalies and Fire data (red) of the Decker Fire from October 1 overlaid on Terra ASTER Precision Terrain Corrected data of the Decker Fire from October 12. This image shows the Decker Fire expanding to the north slope of the mountain ridge due to dry and windy conditions.

Image
Image Caption

Suomi NPP NASA VIIRS Thermal Anomalies and Fire data (red) of the Decker Fire from October 7 overlaid on Terra ASTER Precision Terrain Corrected data of the Decker Fire from October 12. This image shows continued growth of the Decker Fire.

Image
Image Caption

Suomi NPP NASA VIIRS Thermal Anomalies and Fire data (red) of the Decker Fire from October 13 overlaid on Terra ASTER Precision Terrain Corrected data of the Decker Fire from October 12. This image shows the greatest extent of the Decker Fire.

For information on how to apply to be an approved user and submit a request for on-demand ASTER data, visit the NASA JPL ASTER website on Requesting New Acquisitions. All users with a NASA Earthdata Login Account can access archived ASTER data through NASA Earthdata Search.

References

Image References

Sept. 9, 2019, Suomi NPP NASA VIIRS Thermal Anomalies and Fire and Terra ASTER Precision Terrain Corrected Data Granule IDs

  • AST_L1T_00310122019180112_20191013124732_2045
  • VNP14A1.A2019252.h09v05.001.2019255082023

Sept. 13, 2019, Suomi NPP NASA VIIRS Thermal Anomalies and Fire and Terra ASTER Precision Terrain Corrected Data Granule IDs

  • AST_L1T_00310122019180112_20191013124732_2045
  • VNP14A1.A2019256.h09v05.001.2019257173859

Sept. 20, 2019, Suomi NPP NASA VIIRS Thermal Anomalies and Fire and Terra ASTER Precision Terrain Corrected Data Granule IDs

  • AST_L1T_00310122019180112_20191013124732_2045
  • VNP14A1.A2019263.h09v05.001.2019264083639

Sept. 25, 2019, Suomi NPP NASA VIIRS Thermal Anomalies and Fire and Terra ASTER Precision Terrain Corrected Data Granule IDs

  • AST_L1T_00310122019180112_20191013124732_2045
  • VNP14A1.A2019269.h09v05.001.2019276231309

Sept. 30, 2019, Suomi NPP NASA VIIRS Thermal Anomalies and Fire and Terra ASTER Precision Terrain Corrected Data Granule IDs

  • AST_L1T_00310122019180112_20191013124732_2045
  • VNP14A1.A2019273.h09v05.001.2019274081046

Oct. 1, 2019, Suomi NPP NASA VIIRS Thermal Anomalies and Fire and Terra ASTER Precision Terrain Corrected Data Granule IDs

  • AST_L1T_00310122019180112_20191013124732_2045
  • VNP14A1.A2019274.h09v05.001.2019276154942

Oct. 7, 2019, Suomi NPP NASA VIIRS Thermal Anomalies and Fire and Terra ASTER Precision Terrain Corrected Data Granule IDs

  • AST_L1T_00310122019180112_20191013124732_2045
  • VNP14A1.A2019280.h09v05.001.2019281095559

Oct. 13, 2019, Suomi NPP NASA VIIRS Thermal Anomalies and Fire and Terra ASTER Precision Terrain Corrected Data Granule IDs

  • AST_L1T_00310122019180112_20191013124732_2045
  • VNP14A1.A2019286.h09v05.001.2019287110811

Citations

NASA LP DAAC, 2015, ASTER Level 1 Precision Terrain Corrected Registered At-Sensor Radiance V003: NASA EOSDIS Land Processes DAAC, accessed October 25, 2019, at https://doi.org/10.5067/ASTER/AST_L1T.003.

Schroeder, W., and Giglio, L., 2018, VIIRS/NPP Thermal Anomalies/Fire Daily L3 Global 1km SIN Grid V001: NASA EOSDIS Land Processes DAAC, accessed October 25, 2019, at https://doi.org/10.5067/VIIRS/VNP14A1.001.


Details

Last Updated

June 6, 2025

Published

Dec. 2, 2019

Data Center/Project

Land Processes DAAC (LP DAAC)