Introduction

The research team at the University of Montana’s Climate Office recently used several types of land remote sensing data in an effort to update the 1992 Montana Climate Atlas. According to the Montana Climate Office, the new Montana Climate Atlas was created in part to better understand Montana’s climate and to spark a conversation about how climate relates to the resources and industries Montanans depend upon.

As the climate data steward for the Montana Spatial Data Infrastructure (MSDI), the Montana Climate office attempts to identify the public climate datasets that are available as a resource to answer a variety of questions about the climate of Montana. One goal of the atlas is to provide users with sample products for application within their projects.
Instruments and Techniques Used

Data from the Moderate Resolution Imaging Spectroradiometer (MODIS), located on NASA’s Terra and Aqua platforms, was chosen as a primary data source for the Atlas because the sensors are able to capture data over large areas. Additionally, the sensor has a wide range of spatial resolutions, 250, 500 and 1,000 meters, as well as temporal resolutions, including 5 minute, daily, 4 day, 8 day, 16 day, monthly and yearly. All of these factors combined make MODIS a valuable resource for the state of Montana to capture its vast landscapes and observe trends over time.

In general, MODIS data products are used to monitor land cover, albedo, fire, surface reflectance, temperature and vegetation. The Montana Climate Office specifically used the Normalized Difference Vegetation Index (NDVI) and Enhanced Vegetation Index (EVI) from two different MODIS vegetation products. The 16 day, 250 meter resolution vegetation indices product (MOD13Q1) and the monthly 1 kilometer resolution vegetation indices product (MOD13A3) were used to create mosaicked vegetation products for the Montana Climate Atlas. 

Major Findings

Both of these indices can be used to monitor vegetation conditions and describe the amount of green vegetation present in an area. EVI can provide additional insight for densely vegetated areas as it reduces background variations in the canopy layer. These products were also used to derive an annual Drought Severity Index (DSI), which is used to monitor drought in the state and identify wet and dry years.

Image
Image Caption

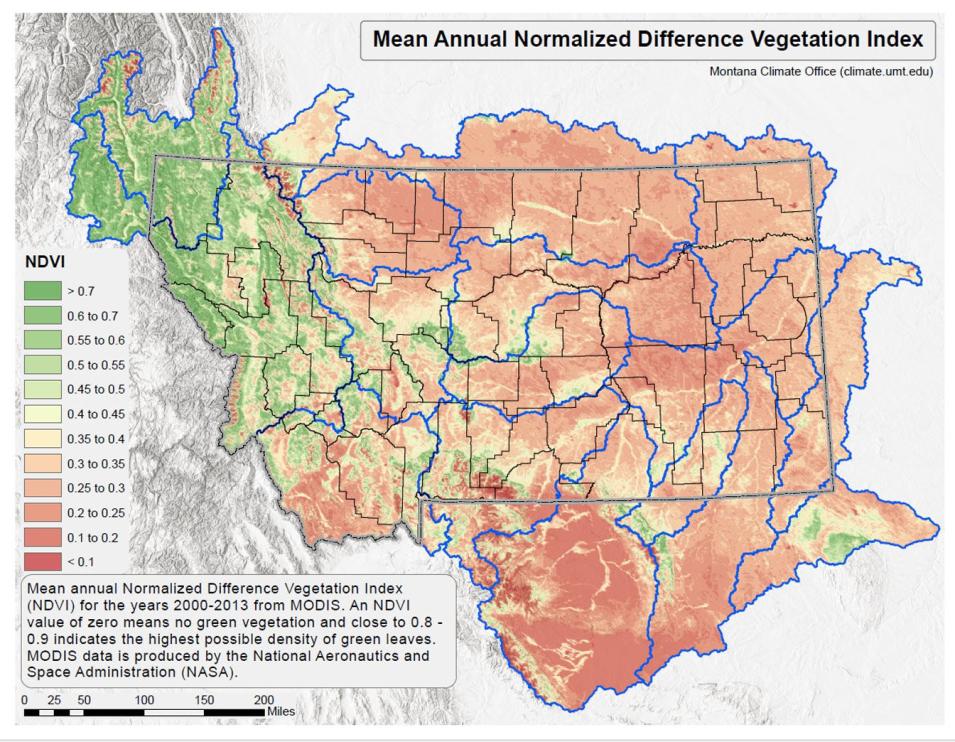
A map from the Montana Climate Atlas of the Mean Annual Normalized Difference Vegetation Index (NDVI). The NDVI utilized in the Atlas is derived from two MODIS products, MOD13Q1 and MOD13A3.

The team also used multiple other data sources to generate products for the Atlas including Daymet and PRISM precipitation and the University of Montana’s TopoWx temperature data, whose algorithm also uses MODIS land surface temperature data (MYD11A2). The data products created from MODIS, in-situ and other data sources will be helpful to many user communities, including those interested in the agriculture, viticulture, forestry and water resources of Montana.

The Montana Climate Atlas is available as a print edition and as well as an online edition that can be used in your browser or GIS software.

Reference

Sweet, M.D., J. Oyler, K. Jencso, S. Running, and A. Ballantyne., 2015, Climate atlas of Montana Montana forest and conservation experiment station: University of Montana September 8, 2015, accessed September 9, 2015.

Details

Last Updated

June 13, 2025

Published

Oct. 21, 2015

Data Center/Project

Land Processes DAAC (LP DAAC)