Introduction

Researchers in a variety of disciplines use NASA’s nighttime lights imagery to track the expansion of human settlements and economic activity, energy use, disaster impacts, and more. However, more than 20% of Earth's population live in areas where the presence and effects of aurorae can dilute measurements of anthropogenic light sources. 

At the same time, researchers focused on space weather—the ever-changing conditions in space around Earth caused by solar events like flares, eruptions, and streams of charged particles—value the contributions of nighttime lights data, as they provide model/product validation and help characterize spatially explicit auroral activity. Evaluating the analysis of space weather predictions is critical for forecasters, users, modelers, and stakeholders as such evaluation can identify strengths and weaknesses of forecast products, facilitate their improvement, and identify additional sources of data that might bolster aurorae monitoring efforts. 

For both research areas, it is critical to be able to identify and differentiate between nighttime lights signals and light contamination from aurorae. 
Image
Image Caption

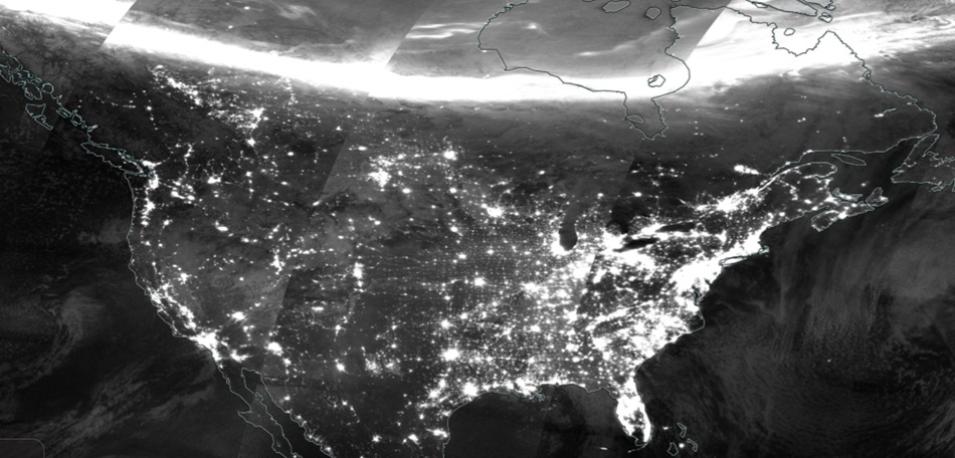
This Day/Night Band image from the VIIRS instrument aboard the Suomi NPP satellite features an aurora in the northern hemisphere on February 22, 2017. Credit: NASA Worldview

VIIRS Day/Night Band Imagery

Imagery from the Day/Night Band (DNB) of the Visible Infrared Imaging Radiometer (VIIRS) aboard the Suomi National Polar-orbiting Partnership (Suomi NPP) satellite (VIIRS DNB) reveals both anthropogenic and natural light phenomena, and VIIRS DNB data can be used to compare aurora forecast space weather probability predictions with actual observations. This is advantageous as space weather prediction faces numerous challenges, including the development of appropriate validation methodologies. 

Currently, stakeholders rely on the predictions of the aurora forecast model that is disseminated by NOAA's Space Weather Prediction Center (SWPC); however, this model does not consider contributions from auroral substorms that are explosive energy storage and release during the progression of a geomagnetic storm. Substorms can cause the auroral oval to change significantly in a much faster temporal scale than any empirical model can predict. Fine resolution aurora data provided by DNB can patch this knowledge gap.

Image
Image Caption

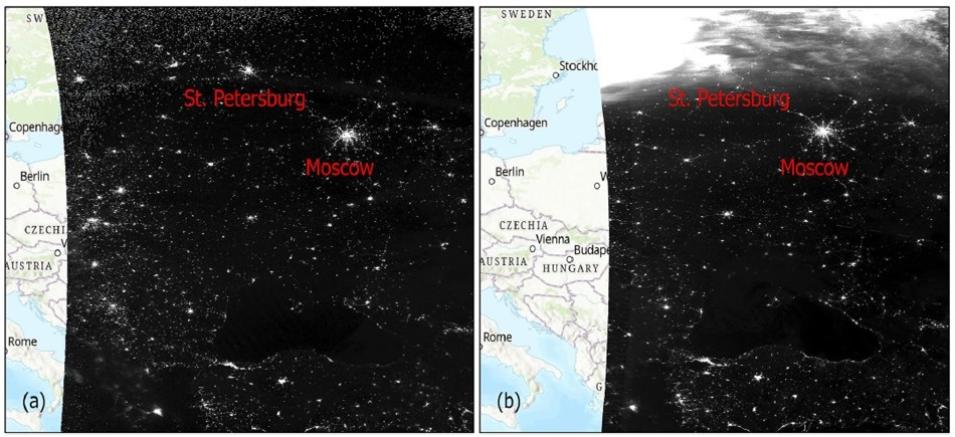
The image on the left, acquired on March 16, 2015 23:00–23:12 Universal Time (UT), clearly shows nighttime lights in northern Russia. The right-hand image, acquired on March 17, 2015 at 23:12–23:24 UT, is obscured by the aurora. Credit: Kalb et al, 2023

Instruments and Techniques Used

To explore whether VIIRS DNB data can be used to differentiate aurora light phenomena from anthropogenic, a team of researchers from NASA and the Catholic University of America compared data from VIIRS DNB with predictions from the aurora forecast model OVATION Prime 2013 (OP-13). The researchers used the St. Patrick's Day geomagnetic storm of 2015 as a case study to compare aurora regions detected in VIIRS DNB data with outputs from the U.S. National Oceanic and Atmospheric Administration (NOAA) Space Weather Prediction Center's (SWPC) aurora probability product. This comparison provided an opportunity to demonstrate the potential of using DNB data as an authoritative source of auroral activity. 

The research team created and tested an aurora binary mask of VIIRS DNB observations created with unsupervised machine-learning methods. The main challenge for aurora detection is the overlap between the radiance levels of the aurora and anthropogenic nighttime lights. However, aurorae have been shown to exhibit a coherent structure distinct from the spatial signature of human settlements. Although this cloud-like formation is difficult to define, the researchers enlisted machine learning to identify spatial patterns and statistical properties of aurorae to both demonstrate the potential of using DNB data as an authoritative source of auroral activity and compare it with predictions from OP-13. 

The team tested their theory by comparing the aurora prediction product and the VIIRS DNB VNP02DNB and VNP03DNB data products for March 17 and 18, 2015, using the aurora binary mask and a technique known as image segmentation, which separated aurorae from anthropogenic light sources, and then automated it to enable production-level processing. 

Using this workflow, the researchers derived a granule-level aurora mask. For each granule, the nearest aurora probability forecast was identified and intersected with the aurora mask. Agreement between the mask and forecast occurred if the mask equaled 1 and the forecast probability was greater or equal to 50%, or if the mask equaled 0 and the forecast probability was less than 50%. These outcomes were termed "true positive" and "true negative," respectively.

Image
Image Caption

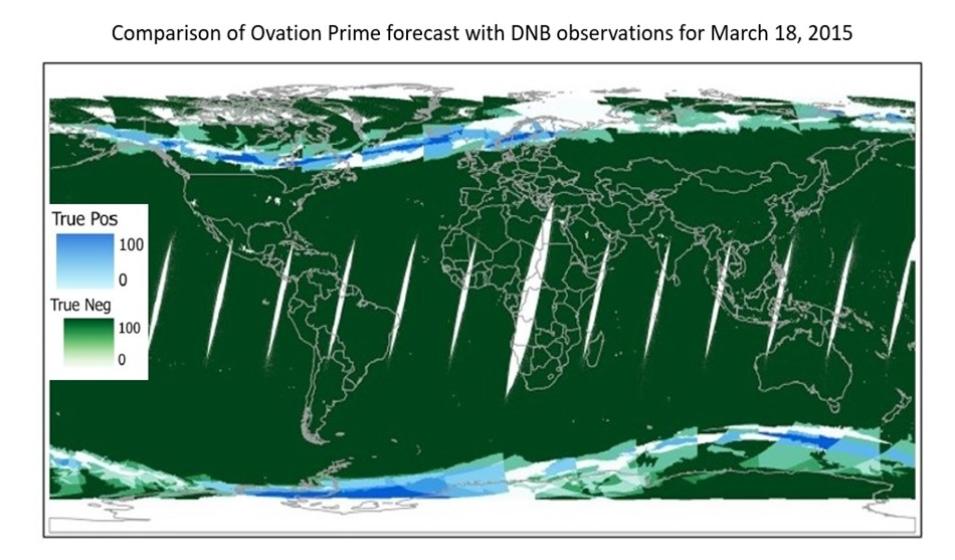
This graphic shows the comparison of predicted aurora with DNB observations for March 17, 2015, with the statistics measuring agreement and disagreement between predicted and observed. There are gaps in equatorial coverage because the researchers elevated the observations to 110 kilometers above the Earth to match the average aurora height. Credit: Kalb et al, 2023

Major Findings

Using the aurora binary mask, the research team was able to flag aurora-contaminated observations in the nighttime lights data products by comparing it against aurora forecast model predictions for the St. Patrick's Day geomagnetic storm in 2015. They found that fine resolution aurora data provided by DNB can make up for gaps in the inputs used to generate SWPC aurora predictions, thereby augmenting aurora forecast model predictions and other sources of aurora observations.

The improved knowledge of auroral specification offered by VIIRS DNB data may provide significant feedback to space weather forecast models and help meet some of the challenges confronting space weather prediction.

Related Links

Kalb, V., Kosar, B., Collado-Vega, Y., and Davidson, C. (2023). Aurora detection from nighttime lights for Earth and Space Science applications. Earth and Space Science, 10, e2022EA002513. doi:10.1029/2022EA002513.

Newell, P. T., Liou, K., Zhang, Y., Sotirelis, T. , Paxton, L. J., and Mitchell, E. J. (2014). OVATION Prime-2013: Extension of auroral precipitation model to higher disturbance levels, Space Weather, 12, 368–379, doi:10.1002/2014SW001056.

Wolfe, R. E., Lin, G., Nishihama, M., Tewari, K. P., Tilton, J. C. and Isaacman, A. R.  (2013). Suomi NPP VIIRS prelaunch and on-orbit geometric calibration and characterization, Journal of Geophysical Research Atmospheres, 118(20), p. 11508–11521, doi:10.1002/jgrd.50873.

Wolfe, R. E., Lin, G., Nishihama, M., Tewari, K. P. and Montano, E. (2012). NPP VIIRS early on-orbit geometric performance, Proceedings of the Society of Photo-Optical Instrumentation Engineers 8510, Earth Observing Systems XVII, 851013 (15 October 2012); doi:10.1117/12.929925

Details

Last Updated

May 30, 2025

Published

May 30, 2025