Introduction
First launched in 2002, eBird is a citizen science-driven project developed by the Cornell Lab of Ornithology to help advance bird related science, conservation, and education efforts. eBird allows birdwatchers around the world to submit their observations regarding when, where, and how they observed various species. Observations are reviewed by experts for quality and then made available to the public. More than 100 million observations have been reported and these observations have been used to support conservation and research efforts.
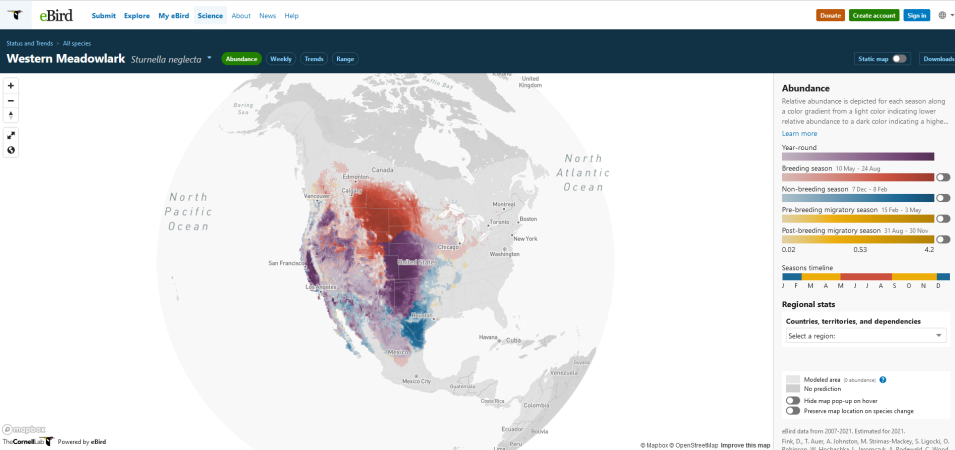
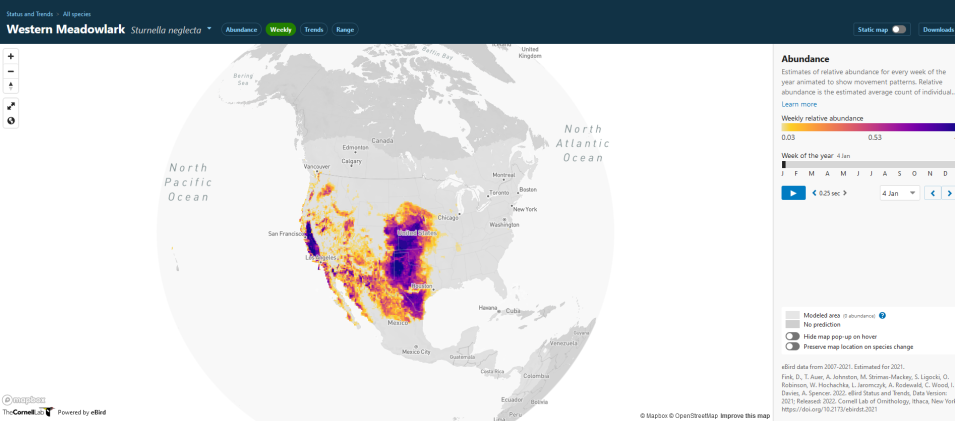
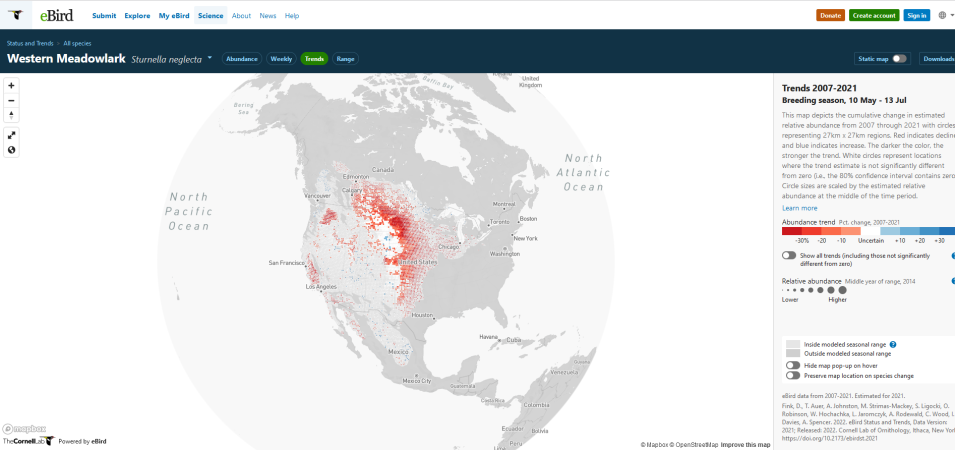
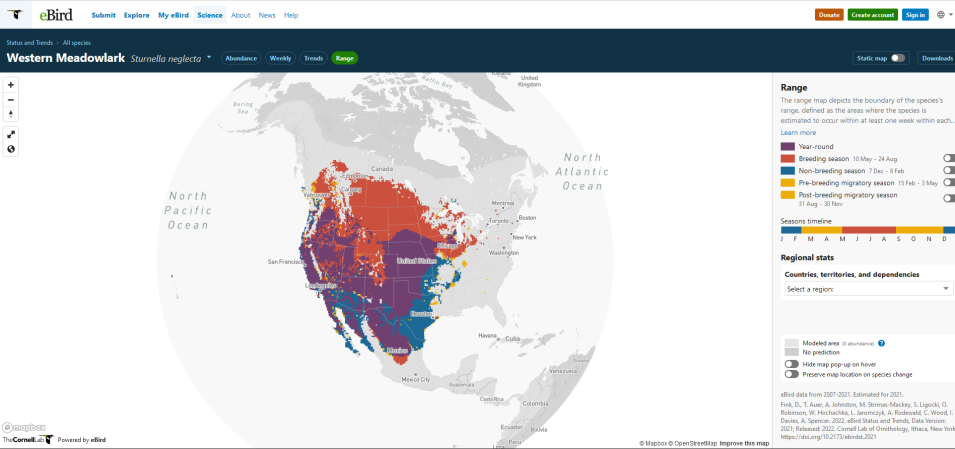
Using eBird data, the Cornell team recently developed an interactive Trends Maps web application to help visualize and describe population occurrence and change for more than 1,000 bird species. The map enables scientists and bird enthusiasts alike to look at “Abundance,” which includes the number of individual birds observed by expert eBirders for that species, the weekly estimate of the abundance for every week of the year, trends of that bird’s abundance during its breeding season, and the boundary of that specific bird’s range during the different points of its annual cycle (Fink and others 2022). This information can help researchers determine the overall health of a population using a global snapshot rather than a localized idea. State and regional statistics are also made available through the map, which allows users to further specify the region they are interested in and how bird species occupy that space throughout the year.
Instruments and Techniques Used
To create these various maps, the eBird team combines the expert eBirder observations with geospatial data, including remote sensing data products distributed by NASA's Land Processes Distributed Active Archive Center (LP DAAC). Data collected via eBird are used in statistical models to create visual maps and images related to the different tab functions on the map. The LP DAAC Data products include the Terra and Aqua combined Moderate Resolution Imaging Spectroradiometer (MODIS) Land Cover Type (MCD12Q1) and Yearly Land Water Mask (MOD44W), as well as the Terra Advanced Spaceborne Thermal Emission and Reflection Radiometer (ASTER) Global Water Bodies Database (ASTWBD) and Global digital Elevation Model (ASTGTM). The MODIS product was used specifically for its temporal ability to capture land cover, use, and hydrology. Twenty-one vegetative indexes are used to describe and identify each pixel generated by MODIS and ASTER.


