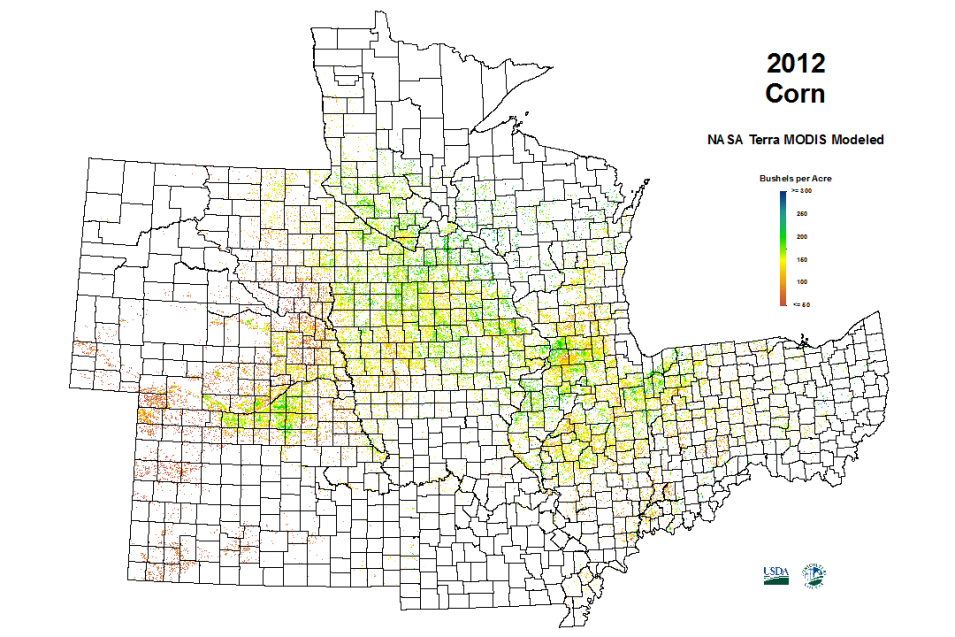
Much of Johnson’s research concentrates on quantifying crops in the Corn Belt region, or as he describes it, the “I” states—Illinois, Indiana, and Iowa (along with surrounding states). The primary crops in this region, by far, are corn (maize) and soybeans, two crops that represent the flagship agricultural products traded on U.S. commodity markets. Along with corn and soybeans, Johnson and his colleagues also apply their research to quantifying wheat (grown throughout the U.S., but most common in the Great Plains region from Texas north through the Dakotas), cotton (primarily found throughout the Southern and Southeastern states), and rice (dominant along the Mississippi River Alluvial Plain, which stretches from southern Louisiana to southern Illinois).
NASS crop production statistics are commonly broken into two components: area and yield. Area is the amount of land used for planting and harvesting; yield is the weight of the crop produced per unit area. Both of these variables fluctuate year-to-year based on controlled factors (such as planting and management decisions) and uncontrolled factors (such as climate and weather). While Johnson’s work and research concentrates on both area and yield, he spends much of his time on the yield side of the equation.
For yield monitoring, Johnson notes that it is best to track crop progress at the county, state, or national level throughout the entire growing season. His sensor of choice for acquiring these data is the Moderate Resolution Imaging Spectroradiometer (MODIS) aboard the Terra and Aqua satellites. For Johnson, MODIS benefits include its near daily revisit rate, adequate spatial resolution of 250m, 15-plus years of well-calibrated and consistent data, and the large amount of research that has been done with the sensor. Johnson also cites the low latency of MODIS products along with straightforward data handling as additional benefits.
One unique aspect of NASS work pointed out by Johnson is that unlike work done in a pure research setting, involving lengthy peer reviews and replications of experiments, NASS works with tight, government-mandated deadlines for reporting crop statistics. Remotely-sensed information used by Johnson and his colleagues needs to be timely and produced with as little delay as possible between the sensor collection of raw data and data product availability. MODIS, even though designed as a research platform, provides near real-time (NRT) products meeting both of these critical criteria.
The MODIS data of most interest to Johnson and his colleagues are surface reflectance and temperature products that have been “composited” over 8 or 16 days to remove cloud and noise effects. In research conducted comparing multiple MODIS data products, Johnson found that certain products are more beneficial for his work on crop estimates. He points in particular to the MODIS Normalized Difference Vegetation Index (NDVI) product, which is positively correlated with crop yields during the peak of the growing season (that is, higher chlorophyll concentrations in healthy vegetation are sensed at the peak of growing season). Land surface temperature, in contrast, is inversely correlated with crop yields during peak growing season (that is, higher land surface temperature readings generally indicate less vegetation cover). The integration of these metrics over the growing season, and the historical performance of these metrics when compared with historical yield information, forms the foundation of NASS crop yield models.
In his research comparing NDVI across a wide range of crops, Johnson finds that the positive correlation between NDVI and yield holds up. The one exception he has found is for rice, which does not appear to have a positive correlation between high NDVI and high yields. Johnson also has looked at relationships between land surface temperature and crop yields, but finds that the results for a range of crops are more mixed and muted when compared with NDVI.
While the overall goal of crop production has not changed in terms of maximizing yield for a given planted area, the use of remotely-sensed data adds greater precision for quantifying the harvest and ultimately improving the NASS mission of providing timely, accurate, and useful statistics in service to U.S. agriculture. The end result is not only better data about crop production, but better economics for both producers and consumers.
Representative data products used:
- Primary products:
- Additional MODIS products (all available through NASA’s LP DAAC):
Read about the research:
Johnson, D.M. (2016). A comprehensive assessment of the correlations between field crop yields and commonly used MODIS products. International Journal of Applied Earth Information and Geoinformation, 52: 65-81. doi:10.1016/j.jag.2016.05.010
Johnson, D.M. (2014). An assessment of pre- and within-season remotely sensed variables for forecasting corn and soybean yields in the United States. Remote Sensing of Environment, 141: 116-128. doi:10.1016/j.rse.2013.10.027
For more information
Explore more Data User Profiles
