User Profile: Dr. Paul Siqueira

The ability for Synthetic Aperture Radar (SAR) to create high-resolution imagery regardless of atmospheric conditions makes it a key technology for studies of change over time. Dr. Paul Siqueira’s work improves these sensors and the Earth observing data they collect.
Image of Dr. Paul Siqueira standing on a mountain wearing a light sweater and sunglasses.
Dr. Siqueira at the Bartlett Experimental Forest in New Hampshire conducting forest inventories to compare ground-measured biomass assessments with UAVSAR data. Image by Lake Boddicker.

Dr. Paul Siqueira, Professor of Electrical and Computer Engineering, and Co-Director of the Microwave Remote Sensing Laboratory; University of Massachusetts, Amherst, MA

Research interests: Exploring and developing new uses for Synthetic Aperture Radar (SAR) for environmental remote sensing, SAR processing, and ecosystems science.

Research highlights: The one true constant on Earth is change. Some of these changes are relatively rapid, such as new land formed by flowing lava as it cools and solidifies or land deformation caused by the sudden release of pressure holding tectonic plates in place. Some changes, however, are barely noticeable until the change already is occurring, such as a shift in climate over many years leading to changes in the range of plant and animal species along with changes in ecosystem structure and function.

The ability to track environmental change from space using instruments aboard orbiting satellites provides the spatial coverage to study the planet as an integrated system. This is especially important in studies involving entire biomes or ecosystems, which can cover large areas of Earth or discrete areas along a common latitude. Thanks to a continuous record of satellite-acquired Earth observations extending back 40 years or more, much of which is available through NASA’s Earth Observing System Data and Information System (EOSDIS), changes to ecosystems over time can be detected, measured, and tracked on a planetary scale. When these data are combined with data acquired from ground-based instruments or airborne sensors, a more complete picture of our planet and its systems is being revealed.

Biological Diversity and Ecological Forecasting Campaign logo , which contains images of a wolf, a leaf, a bird and aquatic vegetation

A key technology enabling large-scale environmental research is Synthetic Aperture Radar (SAR). Dr. Paul Siqueira is applying his expertise in microwave sensor instrument development, SAR processing, and ecosystems science to several upcoming and future orbital missions designed to use SAR technology to assess our changing planet with a greater precision than ever before.

SAR is an active radar system, and collects data by bouncing a microwave radar signal off a surface to acquire data about that surface’s physical properties (passive radar systems, such as a radiometer, detect radiated energy and do not send out a radar pulse). Since SAR relies on radar returns to create imagery, it does not need outside illumination. In addition, the wavelengths used for creating SAR imagery can penetrate clouds and smoke to detect properties of tree canopies and soils. This enables SAR imagery to be created day or night, rain or shine across many different ecosystems. NASA’s repository for SAR data in the EOSDIS collection, and an important source for the SAR data used by Siqueira, is NASA's Alaska Satellite Facility Distributed Active Archive Center (ASF DAAC) at the University of Alaska Fairbanks.

Siqueira is the Ecosystems Science Team Lead for the upcoming joint NASA/Indian Space Research Organization (ISRO) Synthetic Aperture Radar (NISAR) mission, which is scheduled for launch in 2022. NISAR will be the first satellite to systematically map Earth using two different SAR frequencies – an L-band instrument developed by NASA and an S-band instrument developed by ISRO. NISAR will image the entire Earth every 12 days to support research in four primary science areas: ecosystems, hydrology, natural hazards, and the cryosphere. NISAR data will be freely available through ASF DAAC.

NISAR is the latest mission to incorporate L-band SAR, which has a long history of use in Earth observing satellites. The first civilian L-band SAR flew in 1978 aboard the Seasat satellite (operational June to October 1978), and L-band SAR has been used on numerous international Earth observing missions. Its approximately 24 cm-long wavelength (the second longest of common SAR bands) enables L-band SAR to penetrate the tops of forest canopies to reveal above-ground biomass, making it very useful for ecosystem studies. As noted by the Committee on Earth Observation Satellites (CEOS), a consistent archive of L-band SAR data dating back to the mid-1990s exists for most areas of the world.
Image
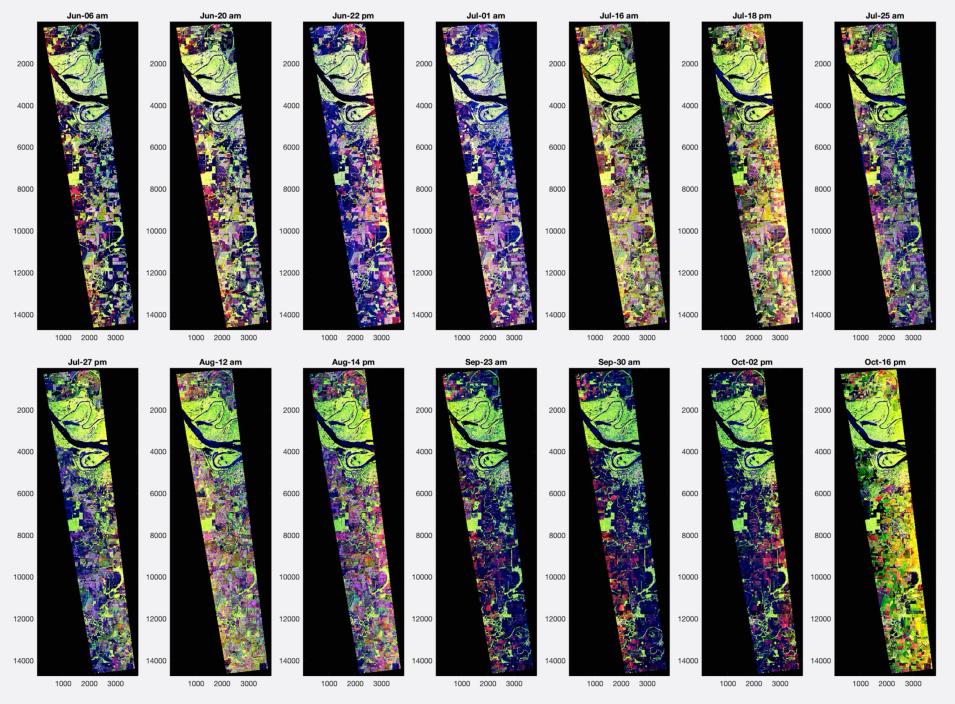
Series of 14 rectangular images acquired by the UAVSAR over a range of false-color bands.
A time-series of UAVSAR images collected during the 2019 NISAR UAVSAR AM-PM campaign. These images mimic the observing pattern of NISAR, which will collect one morning (descending) and one evening (ascending) scene for most of Earth’s land surfaces every 12 days. Data like these can be used to monitor changes to regional landcover and hydrology, and will be an invaluable record for better understanding the dynamics governing our environment. Click on image for larger view. Credit: JPL/Caltech.

Since NISAR data won’t be available until after the satellite becomes operational, Siqueira and his colleagues are preparing to work with and process NISAR data by using a system called the Uninhabited Aerial Vehicle SAR, or UAVSAR. The UAVSAR pod is mounted underneath a NASA jet and flown in campaigns over specific ecosystems, agricultural areas, and landmasses. Siqueira was part of the recent NISAR UAVSAR AM-PM campaign, which took place over the Southeastern U.S. in 2019 and used L-band SAR to aid in the development of NISAR ecosystem science algorithms.

Siqueira also used L-band SAR in his work developing a forest stand height algorithm. A stand is a contiguous area containing a number of trees that are relatively homogeneous or have a common set of characteristics. A stand is generally studied or managed as a single unit. Forest stand height (FSH) is defined as the average height of trees in a forest stand, and is a useful metric for characterizing forest stand age, plant and animal habitats, and the amount of above ground biomass in the forest stand. While FSH is generally collected using airborne instruments, the use of satellite-borne SAR enables these measurements to be collected over a much larger spatial area and has important applications in better quantifying and monitoring the global carbon budget.

Image
Four image collage with false color images on left (grading from gray on left to purple on right) and interferograms on right (with colored fringes grading from yellow on left to pink on right).
An example of an interferogram produced from UAVSAR imagery obtained on two different days in a forested and agriculture region southeast of Little Rock, AR. Left images: False-color images illustrating a clear distinction between forested and agricultural regions. Right images: The interferometric products of phase and correlation magnitude provide information on surface change, surface hydrology, and volumetric scattering in the false-color images. Click on image for larger view. Credit: Dr. Paul Siqueira.

Siqueira used interferometric SAR (InSAR) data in his FSH SAR observations. As explained on the NASA NISAR webpage, InSAR techniques combine two or more SAR images acquired over the same region to reveal surface topography, surface elevation change, and the presence of volume scatterers (e.g., leaves, branches, and other objects that can scatter incoming radar waves) in an image called an interferogram. When the combined SAR images are acquired from slightly different positions or angles, the topography of the surface can be precisely mapped. The InSAR imagery used by Siqueira in his algorithm development were from the Japan Aerospace Exploration Agency (JAXA) Advanced Land Observing Satellite (ALOS) Phased Array type L-band Synthetic Aperture Radar (PALSAR) mission (operational 2006 to 2011). ALOS PALSAR data are distributed by ASF DAAC through an international agreement with JAXA and are copyright JAXA and the Japanese Ministry of Economy, Trade, and Industry. As Siqueira observes, an estimate of vegetation height can be determined by the difference between the InSAR-measured height and ground surface elevation acquired from a Digital Elevation Model (DEM).

The launch of NISAR will enable Siqueira to apply this method of FSH determination over large regions, especially when integrated with lidar data from missions such as the joint NASA/University of Maryland Global Ecosystem Dynamics Investigation (GEDI; launched in December 2018 and installed aboard the International Space Station). Lower-level (Level 1 and 2) GEDI data currently are available through NASA’s Land Processes DAAC (LP DAAC); higher-level (Level 3 and 4) GEDI data soon will be available publicly through NASA’s Oak Ridge National Laboratory DAAC (ORNL DAAC).

Along with missions scheduled for launch like NISAR, Siqueira is involved with the planning and formulation for future NASA missions incorporating SAR technology. One objective for future missions is to use satellite-collected InSAR data for studies of surface deformation and change. Deformation measurements acquired using InSAR are an important tool for understanding the dynamics of earthquakes, volcanoes, landslides, glaciers, groundwater, and Earth’s deep interior; for quantifying the rates and driving processes of sea-level change and landscape change; and for supporting hazard forecasts and disaster impact assessments. As the Ecosystems Study Lead for NASA’s Surface Deformation and Change (SDC) study team, Siqueira is evaluating the use of SAR and InSAR for future NASA missions. The SDC study started in October 2018 and is scheduled to end in September 2023 with an architecture for a proposed SDC satellite mission.

Of course, change on Earth won’t wait for future missions, and continues, sometimes quickly, sometimes inexorably slowly. Through Siqueira’s work, instruments to measure, track, and study these changes and their effect on ecosystems are becoming ever more powerful and are delivering data that are providing a growing understanding of not only the drivers of these changes, but also their potential consequences.

Representative data products used:

Read about the research:

Chapman, B., Siqueira, P., Saatchi, S., Simard, M. & Kellndorfer, J. (2019). Initial results from the 2019 NISAR Ecosystem Cal/Val Exercise in the SE USA. IGARSS 2019 - 2019 IEEE International Geoscience and Remote Sensing Symposium, Yokohama, Japan, 2019: 8641-8644. doi:10.1109/IGARSS.2019.8899227

Siqueira, P. (2019). Forest Stand Height Estimation. In SAR Handbook: Comprehensive Methodologies for Forest Monitoring and Biomass Estimation, Chapter 4. Flores-Anderson, A., Herndon, K., Thapa, R. & Cherrington, E., eds. SERVIR Global Science Coordination Office, doi:10.25966/nr2c-s697. Available online (PDF).

Whelen, T. & Siqueira, P. (2018). Time-series agricultural classification of Sentinel-1 data over North Dakota. Remote Sensing Letters, 9(5), 411-420. doi:10.1080/2150704x.2018.1430393

Lei, Y., Siqueira, P. & Treuhaft, R. (2016). A dense-medium electromagnetic scattering model for the InSAR correlation of snow. Radio Science, 51(5): 461-480. doi:10.1002/2015rs005926


Explore more Data User Profiles

Last Updated