User Profile: Dr. Frederick Bingham

Salinity data from NASA’s Physical Oceanography Distributed Active Archive Center (PO.DAAC) help Dr. Frederick Bingham study ocean dynamics.

Dr. Frederick Bingham, Professor, University of North Carolina Wilmington, Department of Physics and Physical Oceanography

Image
Dr. Frederick Bingham, a member of the PO.DAAC User Working Group, uses sea surface salinity data to study ocean dynamics. Credit: Image courtesy of Frederick Bingham.

Research Interests: Ocean salinity, its role in ocean dynamics and the water cycle, and its variability; data management for large oceanographic field campaigns.

Research Highlights: Everyone knows seawater is salty, but few know that even small variations in sea surface salinity (i.e., the concentration of dissolved salts at the sea surface) can have dramatic effects on the water cycle—the path water molecules take as they make their way from Earth’s surface to the atmosphere and back again. In fact, ocean surface salinity is the key variable that scientists use to better understand how inputs and outputs of fresh water affect ocean dynamics.

By tracking ocean surface salinity with data from Earth-observing satellites and in-situ sensors like Argo floats and buoys, scientists can monitor variations in the water cycle including land runoff, sea ice freezing and melting, and evaporation and precipitation over the ocean. In addition, now that they have decades of salinity data at their disposal, scientists have discovered a world of patterns and variations in ocean salinity. Such insights are noteworthy, as salinity can impact ocean circulation, which in turn can have significant impacts on Earth’s climate.

Among the scientists studying the variability of ocean salinity, its role in ocean dynamics, and its impact on the water cycle is Dr. Frederick Bingham, a professor in the Department of Physics and Physical Oceanography at the University of North Carolina Wilmington.

“The aim of my work is to try to understand how the water cycle works,” Bingham said. “Ninety percent of the water cycle occurs in and around the ocean and the ocean provides all of the water for everything that takes place on land, so understanding the ocean’s part in the water cycle is of paramount importance. Salinity is a great window into that.”

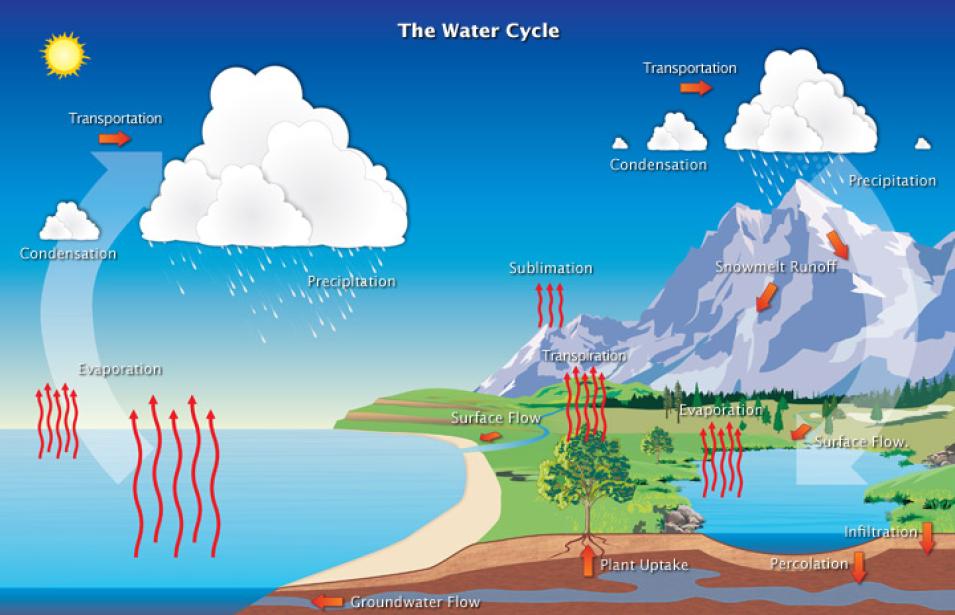
Sea surface salinity is always in flux. When fresh water is pulled off the ocean's surface through the process of evaporation, the ocean gets saltier. Conversely, when fresh water enters the ocean in the form of precipitation, the ocean water gets less salty. These natural phenomena, along with several others (e.g., ocean currents, wind, ice melt, etc.) are what enable Bingham to use the ocean as something of a gauge for deciphering its part in and impact on the water cycle.
Image
The water cycle refers to the continuous movement of Earth’s water through the atmosphere, into and out of the oceans, over the land surface, and underground. According to Bingham, 90% of the water cycle occurs in and around the ocean, and the ocean provides all of the water for everything that takes place on land. Credit: NOAA National Weather Service Jetstream.

“I look at the temporal and spatial scales of variation in sea surface salinity,” Bigham said. “This tells us about what processes in the ocean and atmosphere might be causing those variations. This might be either interaction with the atmosphere via rainfall and evaporation, or internal ocean variability in the form of small-scale eddies and swirls.”

To do that “looking” over large areas and over time, Bingham relies on Earth observation data from a variety of sources, including NASA’s Physical Oceanography Distributed Active Archive Center (PO.DAAC). Located at NASA's Jet Propulsion Laboratory (JPL) in Southern California, PO.DAAC manages, archives, and distributes data from more than 30 satellite and instrument missions pertaining to the physical processes and condition of the global ocean, the cryosphere, and the terrestrial hydrosphere along with tools and resources for working with these data.

“We’ve made extensive use of NASA’s Aquarius and Soil Moisture Active Passive (SMAP) sea surface salinity products from PO.DAAC,” Bingham said. “We have also used NASA’s Estimating the Circulation and Climate of the Ocean (ECCO) model. Because of its extremely high resolution [this model] can be used to test out ideas regarding the time and space scales of sea surface salinity and to understand the process by which the satellite data are validated.”

Aquarius was the primary instrument on the joint NASA/Argentinean Space Agency Aquarius/Satélite de Aplicaciones Científicas (SAC)-D mission, which launched June 10, 2011, and ended on June 8, 2015. Aquarius was designed to measure ocean surface salinity around the globe every seven days, and during its lifetime the mission provided monthly maps of global changes in ocean surface salinity with a resolution of 150 kilometers (93 miles). These data show how salinity changes from month-to-month, season-to-season, and year-to-year. Although salinity levels in the open ocean generally range from 32 to 37 practical salinity units (or psu, roughly equivalent to parts per thousand), the Aquarius sensor was able to detect changes in salinity as small as 0.2 psu—the equivalent to about a “pinch” (i.e., 1/8 of a teaspoon) of salt in one gallon of water.

SMAP was launched on January 31, 2015, and its onboard instruments began observations in April of that year. Although SMAP was designed to measure soil moisture, its L-band radiometer is also used to measure sea surface salinity, thereby extending the sea surface salinity data record started by the Aquarius mission.

In addition to Aquarius and SMAP, Bingham and his colleagues use data from the NASA-funded Salinity Processes in the Upper Ocean Regional Study (SPURS) project, which is a series of science process studies and associated oceanographic field campaigns designed to investigate the mechanisms driving (near) surface salinity variations in Earth’s ocean. To do this, SPURS employs a suite of state-of-the-art in-situ sampling technologies that, when combined with remotely sensed salinity data from Aquarius, SMAP, and the ESA (European Space Agency) Soil Moisture and Ocean Salinity (SMOS) satellite, provide scientists with a detailed assessment of salinity over a variety of spatiotemporal scales.

Although Bingham believes the SPURS project has succeeded in sampling sea surface salinity fields with enough density to ground truth satellite and ECCO model data in one specific location and time, he says that, in general, measuring sea surface salinity is nearly impossible without data from satellites like Aquarius or SMAP.

“There’s just no way of accomplishing that with in-situ data, and by in-situ, I mean an instrument in the water,” he said. “You just couldn’t have anything like the time and space resolution of those satellites, even though they’re somewhat low resolution themselves. They give us glimpses into how sea surface salinity varies that we never had.”

Such glimpses have allowed Bingham and his colleagues to see things like large-scale shifts in surface salinity patterns.

“The surface salinity of the ocean has a very characteristic pattern. Mainly, it’s very salty in the mid-latitudes, so 20 to 30 degrees North, but then as you move toward the equator or toward the poles it gets much fresher. These patterns of saltiness and freshness are maintained by the evaporation and precipitation that occurs at the surface, and you can see [them] move around,” Bingham said. “My interest is in the salty mid-latitude regions and how they move from place to place and change over time. [We’ve gotten] really interesting results that we never would have gotten with in-situ data.”

Image
NASA's Aquarius instrument was launched in June 2011 and completed its mission in June 2015. It measured changes in salinity, or salt concentration, in the surface of the oceans. In fall 2011, the Aquarius team released this first global map of ocean saltiness, a composite of the first two and a half weeks of data since the instrument became operational on August 25, 2011. Red, orange, and yellow areas on the image indicate regions of highest salinity (in grams per kilogram or parts per thousand). Purple and blue areas indicate regions of lowest salinity. Credit: NASA/Goddard Space Flight Center/JPL-Caltech.

Bingham published those results in a 2023 paper highlighting how sea surface salinity can be used to study ocean circulation and air-sea interaction on a large scale, as salinity is a sensitive indicator of changes in both. The paper documents an experiment that used several different satellites and in-situ datasets to track changes in the sea surface salinity maximum of the South Indian Ocean, a very salty region of the ocean to the west of the Australian continent.

To conduct this study, Bingham and his colleagues collected Aquarius and SMAP sea surface salinity data and other datasets, such as precipitation data from the Integrated Multi-satellitE Retrievals for GPM (IMERG), and then examined sea surface salinity variations in the region from 2004 to 2020. The researchers observed that the South Indian sea surface salinity maximum (SISSS-max) moved over a large distance (1,000 kilometers or more) and got saltier and fresher from year-to-year.

“The centroid of the SISSS-max moves seasonally north and south, farthest north in late winter and south in late summer. Interannually, the SISSS-max has moved on a northeast-southwest path about 1,500 km in length,” the researchers write in their paper. “The size and maximum sea surface salinity of the feature vary in tandem with this motion. It gets larger and saltier as it moves to the northeast (and smaller and fresher as it moves to the southwest) closer to (or further from) the area of strongest surface freshwater flux. The area of the SISSS-max almost doubles from its smallest to largest extent. It was maximum in area in 2006, decreased steadily until it reached a minimum in 2013, and then increased again.”

Image
This graphic shows the annual-average centroid position from in-situ data. The centroid’s position is color-coded by year with the scale at right. The light black line is the annual average. The green line is the same contour averaged for 2013, when the area is minimum and the feature is far to the southwest. The yellow and black line is for the year 2020, when the area is large and the feature is far to the northeast. Credit: Image courtesy of Frederick Bingham.

According to Bingham and his colleagues, the variations in the SISSS-max are the result of a “complex dance” of natural phenomena, including “changes in evaporation, precipitation, wind forcing, gyre-scale ocean circulation, and downward Ekman pumping (which results in areas of downwelling)” and further enhance the physical oceanography community’s understanding of the ocean’s role in the water cycle.

“Changes in these kinds of features over time can tell you how much water is coming in off of the ocean and how much is being rained back down,” Bingham said. “It may also demonstrate how ocean circulation changes over time.”

Beyond studying ocean processes, Bingham also studies the methods used to validate sea surface salinity satellite data.  

In his most recent paper (which is in review at the time of this writing), Bingham, lead author Dr. Séverine Fournier of JPL, and others used the ECCO model to study the way that satellites sample the ocean so they could better distinguish subfootprint variability (i.e., the variability of sea surface salinity within the satellite’s observational footprint) from errors caused by instruments.

“We used one year of the high-resolution ECCO model output and pretended to fly the Aquarius, SMOS, and SMAP satellites over it," said Bingham. "The ocean was sampled using the satellites’ footprints and ground tracks. The model was also sampled using in-situ Argo float and mooring data. [Then] we generated gridded products for both the satellites and the float data.”

Through this effort, Bingham and his colleagues were able to make maps of subfootprint variability and quantify it globally, which had never been done at such high resolution.

“We were able to quantify the sea surface salinity representation error (i.e., subfootprint variability), which is the mismatch associated with the comparison of Argo floats and footprint-averaged satellite values,” Bingham said. “Along the way, we came to understand that subfootprint variability, and small-scale variability of sea surface salinity in general, is seasonal; it varies from one season to another and it varies substantially from one part of the ocean to another. This [conclusion] will lead to further studies to try to understand why, and what implications [this variability] has on the study ocean circulation and variability.”

The accuracy and quality of physical oceanography data are of particular importance to Bingham who, in addition to serving as a member of PO.DAAC’s User Working Group (UWG), works with the DAAC to ensure the data it receives from oceanographic field campaigns is of the highest quality.

“We have these large NASA-funded field campaigns—SPURS, the Sub-Mesoscale Ocean Dynamics Experiment (S-MODE), and the Salinity and Stratification at the Sea Ice Edge (SASSIE) project—in which you have investigators sending instruments out in to the ocean to collect a variety of data,” Bingham said. “My job with those programs is to make sure the data have all the right metadata before they are submitted to PO.DAAC. That is, the data need to be described as to when and where they were collected, by whom, and using what instruments.”

This focus on data quality is integral to PO.DAAC’s mission to preserve NASA’s ocean and climate data and make these data open and accessible.

“PO.DAAC works very hard to make sure the data pulled into its system have the appropriate metadata so that users understand what they provide. That’s a very unique function,” Bingham said. “Anybody can put an instrument in the water, collect a bunch of data, and post [the data] online, but that dataset won’t have people who’ve looked at the metadata to make sure that [the metadata] were good quality and compliant with standards. Any dataset that you get from PO.DAAC is going to have this type of information. It’s a very important service.”

Representative Data Products Used or Created:

Available through PO.DAAC:

Other Data Products:

Read about the Research:

Bingham, F.M., Brodnitz, S.K., & Gordon, A.L. (2023). Seasonal and interannual variability of the subtropical South Indian Ocean sea surface salinity maximum. Journal of Geophysical Research: Oceans, 128(2), e2022JC018982. doi:10.1029/2022JC018982

Chkrebtii, O.A., & Bingham, F.M. (2023). Automatic Detection of Rainfall at Hourly Time Scales from Mooring Near-Surface Salinity in the Eastern Tropical Pacific. Artificial Intelligence for the Earth Systems, 2: 220009, doi:10.1175/AIES-D-22-0009.1

Bingham, F.M. (2019). Subfootprint Variability of Sea Surface Salinity Observed during the SPURS-1 and SPURS-2 Field Campaigns. Remote Sensing, 11(22): 2689. doi:10.3390/rs11222689


Explore more data user profiles

Last Updated