Dr. Kyla Dahlin, Associate Professor, Michigan State University; Department of Geography, Environment, and Spatial Sciences; Program in Ecology, Evolution, and Behavior
Research Interests: Terrestrial ecology, the intersection of ecology and geography (ecogeography), biology, environmental management, and Earth system modelling.
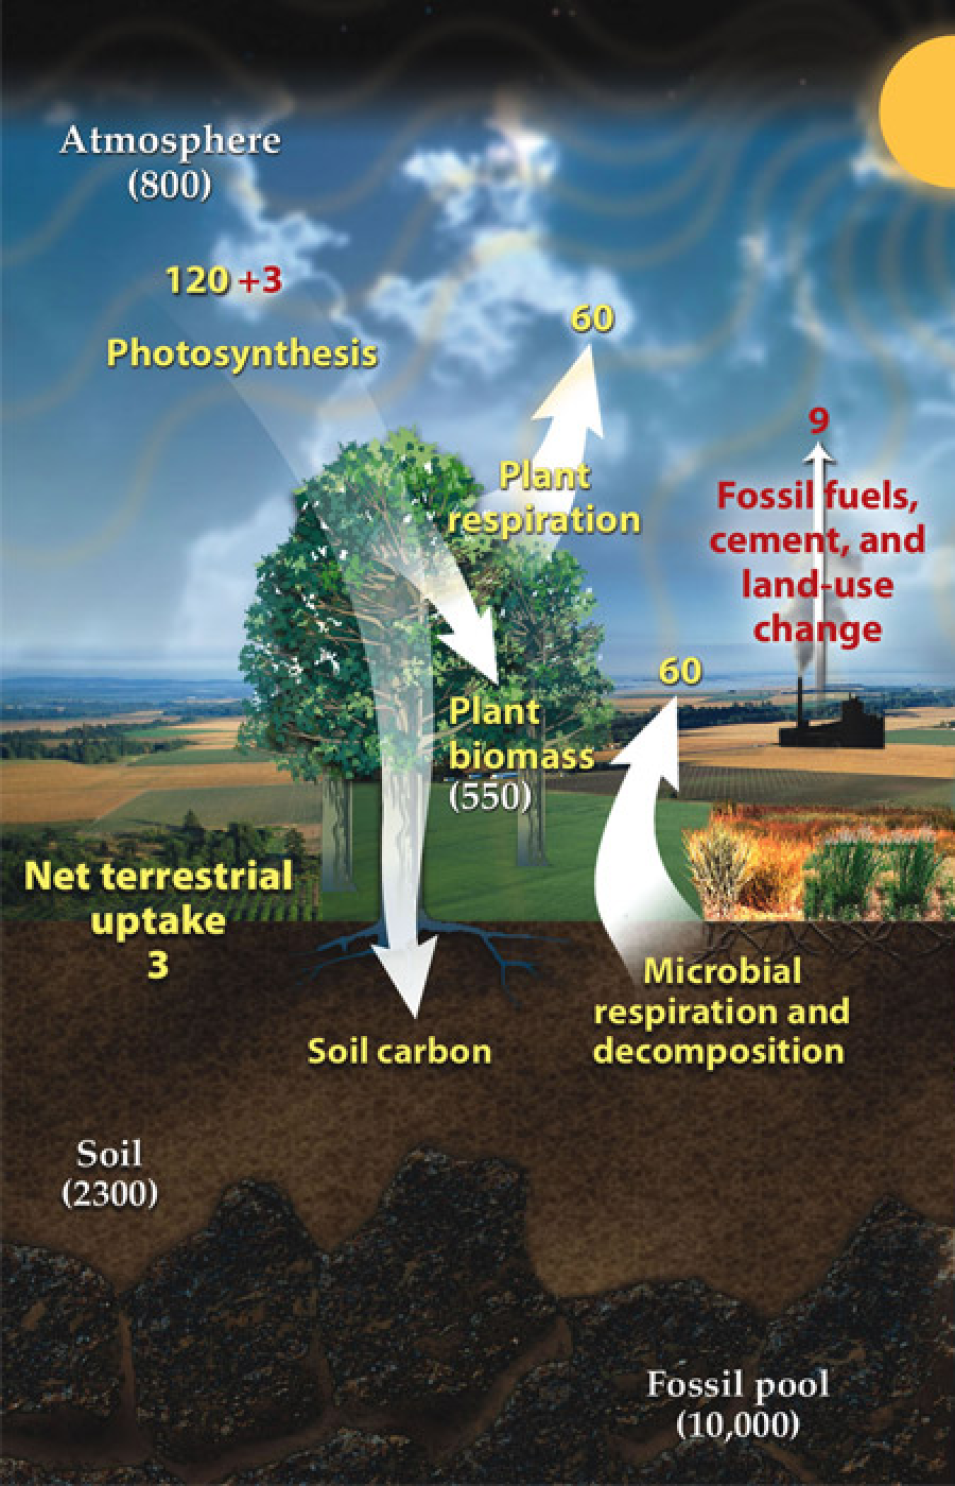
Research Highlights: Carbon—one of the primary building blocks of all organic matter on Earth—is a fundamental part of the Earth system, and it moves through the planet’s atmospheric, terrestrial, and marine ecosystems through a range of biological, chemical, geological, and physical processes known as the carbon cycle.
For most people, the movement of carbon through the environment is evident in the lives of plants and animals. Plants grow by converting carbon dioxide (CO2), water, and sunlight to biomass (e.g., leaves and stems) and oxygen through photosynthesis. Then, the carbon returns to the atmosphere when the plants decay, are eaten and digested by animals, or burn in fires.
The way the carbon cycle is beginning to change due to increased levels of CO2 in the atmosphere is noticeable, too. For example, warmer temperatures are lengthening the growing seasons of plants, causing them to bloom earlier in the year and thereby altering food supplies for the animals that depend on them. It’s possible, of course, that longer growing seasons may result in more CO2 being taken out of the atmosphere. On the other hand, if increased warming leads to greater instances of drought and increased plant stress, plant growth may slow, resulting in more carbon being released into the atmosphere and even greater warming.
To figure out whether terrestrial vegetation will store more carbon (i.e., be a carbon sink) in the future or release it back into the atmosphere (i.e., be a carbon source), scientists rely on forecasts from ecosystem models infused with data from a range of sources. Their results, however, don’t always agree.
“Right now, we don’t know whether terrestrial ecosystems are going to become carbon sources or carbon sinks in the next 100 years, and there is research saying both will happen,” said Dr. Kyla Dahlin, an Associate Professor in Michigan State University’s Department of Geography, Environment, and Spatial Sciences and Program in Ecology, Evolution, and Behavior. “Model predictions depend on the particular ecosystem and spatial scale you’re looking at, the model that you’re using, and how you’re accounting for all the various ecosystem components."
Much of this uncertainty is associated with the inherent complexity of ecosystems themselves, as ecosystem processes are affected by a wide range of variables that can make it difficult to predict how they might change in the future. Yet, some of the uncertainty can be attributed to models as well.
“If you look at a lot of different ecosystem models, the [range of] what they’re predicting into the future gets wider and wider,” said Dahlin. “This is driven by the different ways models ‘think’ terrestrial ecosystems work.”
To help reduce this uncertainty, Dahlin and her colleagues have been studying how ecosystem variables, such as forest structure and species variability, impact carbon sequestration—information that could be used to improve model predictions of how climate change will impact plants and, more broadly, the entire Earth system.
“It’s been shown that more heterogeneous and structurally complex forests, even if they’re the same density and overall height, take up more carbon than more homogeneous forests. That suggests we should conserve our older, more heterogenous forests, and it’s something we could potentially manage for,” Dahlin said. “But these results are from a relatively small number of studies, so whether that translates to the global scale we don’t know yet.”
Finding out is of the utmost importance.
“If terrestrial ecosystems start releasing a lot of carbon into the atmosphere, then that’s a big problem because they’ve really been a big buffer for the past several hundred years against the increased CO2 that we’ve put into the atmosphere; but if they are actually able to catch up and take up more CO2, then that would be great.”
Dahlin’s approach to resolving some of these unknowns is to, in her words, “bridge the gap” between localized, small-scale ecological studies and land surface models (which operate at much larger scales) to better understand how ecosystems work within more ecologically relevant boundaries. NASA Earth science data are an integral part of this effort.
“A lot of our work involves the use of different remote sensing tools, including airborne tools, so we can really get at that watershed scale,” Dahlin said. “Times series imagery from the Operational Land Imager (OLI) instrument aboard [the joint NASA/USGS] Landsat satellites and the Moderate Resolution Imaging Spectroradiometer (MODIS) aboard NASA’s Aqua and Terra satellites are also useful.”
Time series imagery is particularly beneficial for Dahlin’s work in phenology (i.e., the study of cyclical and seasonal natural phenomena), as it allows her to monitor the seasonal changes in vegetation in ecosystems around the globe.
“Different forests have different phenologies, meaning their structure and physiological heterogeneity changes over the course of the season,” she said. “So, depending on the question we’re trying to answer, we look at data from Landsat or MODIS aboard NASA’s Aqua and even the Advanced Very High Resolution Radiometer (AVHRR) [which has flown aboard several NOAA satellites]. I’m also using time series imagery in another project designed to help us understand how changes over time have influenced the structure and function of forests in the present.”
Dahlin also uses data from the Airborne Visible/Infrared Imaging Spectrometer (AVIRIS) and the AVIRIS-Next Generation (AVIRIS-NG) airborne sensors that have flown on several aircraft, including NASA's ER-2 research plane. These instruments observe changes in light reflected from Earth to obtain accurate, quantitative characterizations of the composition and features of Earth's surface, including vegetation.
Dahlin and her colleagues obtain these and other data from several sources, including NASA's Oak Ridge National Laboratory Distributed Active Archive Center (ORNL DAAC). Operated by the Oak Ridge National Laboratory in Oak Ridge, Tennessee, the DAAC is a partnership between NASA and the U.S. Department of Energy, and ingests, processes, archives, and distributes data products pertaining to terrestrial biogeochemistry and ecological dynamics in NASA’s Earth Observing System Data and Information System (EOSDIS) collection.
For an example of how datasets like those archived at ORNL DAAC and other repositories inform Dahlin’s research, one need only consult a few of Dahlin’s publications, such as a 2020 paper she and her colleagues published in the journal Land. In this publication, Dahlin and her research team presented the results of an experiment in which they compared outputs from a Land Surface Model known as the Community Land Model (CLM) with Landsat, MODIS, and ESA (European Space Agency) Sentinel-2 satellite observations to determine how well the CLM represented several ecological processes within southwestern Michigan’s Kalamazoo watershed.
The experiment’s results showed good correlation between the satellite observations and the model’s inputs for annual temperature and precipitation, but significant differences between the satellite data and the model outputs on ecological parameters.
“For CLM processes (outputs), seasonal changes in leaf area index (LAI) do not track satellite estimates well, and peak LAI in the CLM is nearly double the satellite record,” the researchers write. “Estimates of greenness and productivity, however, are more similar between the CLM and [the satellite] observations. Summer soil moisture tracks in timing but not magnitude. Land surface reflectance shows significant positive correlations in the winter, but not in the summer.”
Based on these findings, Dahlin and her colleagues identified several areas in which the model could be improved, including land cover distribution estimates, phenology algorithms, summertime radiative transfer modelling, and plant stress responses. Such conclusions are important, the researchers note, because these models are often used to inform land use planning; therefore, it’s imperative for decision-makers to be aware of the uncertainty in model outputs.
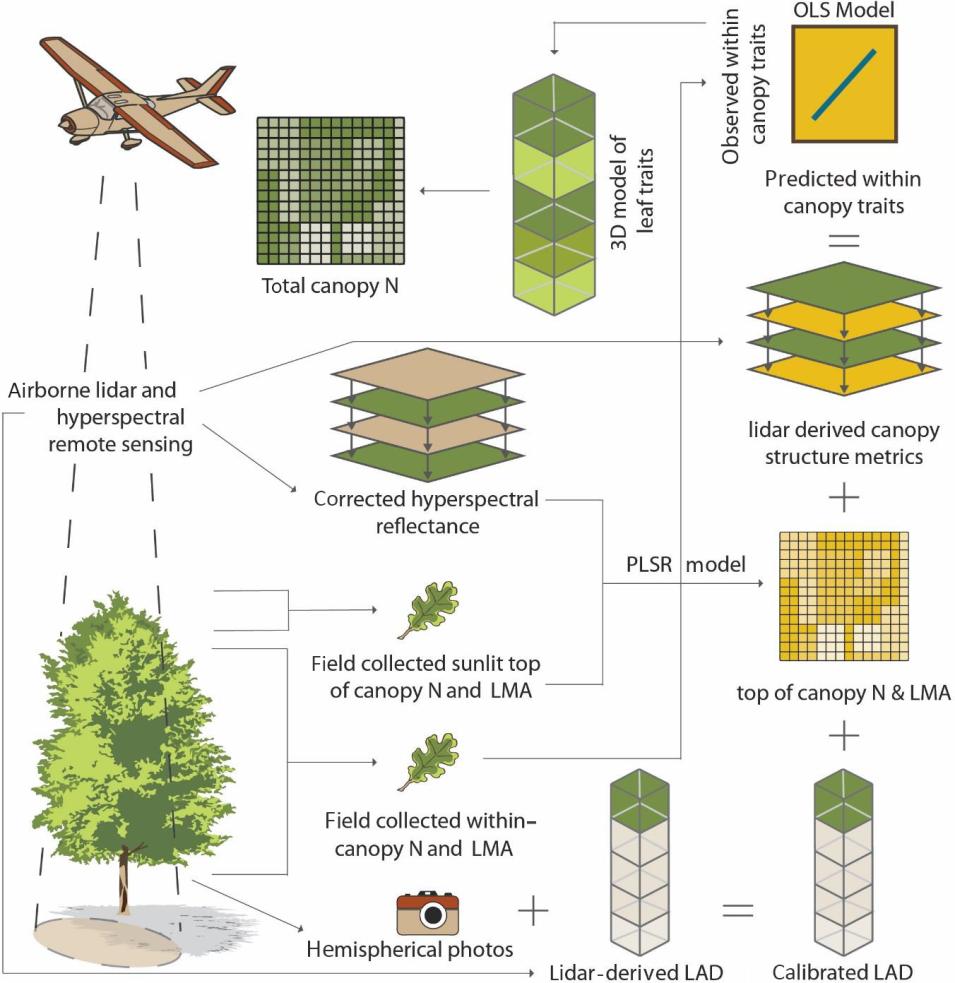
The theme of improving ecological models also surfaced in a paper Dahlin, lead author Dr. Aaron Kamoske, and others published in the journal Ecological Applications in 2021. In this publication, Dahlin and her colleagues evaluate a methodology for conducting within-canopy trait modeling that combines airborne lidar and hyperspectral observations with field-collected data.
The study took place on an actively-managed 13,096 acre (5,300 hectare) National Ecological Observatory Network's Airborne Observation Platform (NEON AOP) site within Alabama’s Talladega National Forest. Because the site featured a mosaic of forest types and both coniferous (pine) and deciduous (oak, magnolia, and other) species, it allowed the researchers to assess the impacts of forest structure on spatial patterns of nitrogen and examine the influence of abiotic gradients (i.e., environmental conditions) and management regimes on the percent of nitrogen in the top of a forest canopy and the total amount of nitrogen (measured in grams per square meter of ground) within a forest canopy.
“We can fly a plane over [a site], get hyperspectral data, and then take that information and convert it into interesting physiological [parameters], like leaf nitrogen content and leaf mass per area, but [when you do that] you’re really only measuring the top of the canopy and you’re not going all the way through,” said Dahlin. “So, we modeled the leaf density through the canopy using lidar and then developed maps of top-of-canopy leaf nitrogen concentration [from the hyperspectral data] and total canopy leaf nitrogen [from the combined lidar and hyperspectral data].”
Comparison of the maps revealed that, in contrast to top of canopy nitrogen values, the variation of total canopy nitrogen is dampened across this landscape, resulting in relatively homogeneous spatial patterns. At the same time, the researchers found that leaf functional diversity and canopy structural diversity exhibited branching patterns associated with the spatial distribution of plant functional types.
This is important, the researchers note, because although forest structural and functional diversity drive critical canopy processes related to carbon sequestration, they are rarely considered together at ecosystem scales. Adopting remote-sensing methodologies like the one Dahlin and her colleagues evaluated in this paper could address that.
“What we showed was that all of those differences [in nitrogen values] that you see when you’re just looking at the top of the canopy kind of go away when you sum-up the entire canopy,” Dahlin said. “That’s interesting because, potentially, it means that a lot of the dramatic differences [seen] when comparing two leaves side-by-side may not be that significant when you start thinking about the entire canopy.”
Such findings, Dahlin notes, could one day improve scientists’ ability to represent ecological processes like carbon sequestration in landscape, continental, and global models.
“We haven’t gotten there yet, but it’s interesting that there have been decades of research on leaf traits but connecting it to whole canopy physiology may not be as direct as originally thought,” she said. “That has potential consequences for how we think forests work.”
When that day comes, the ORNL DAAC and the other EOSDIS DAACs will be there to supply ecologists like Dahlin with the data they need to better understand Earth’s terrestrial ecosystems and improve the models helping us to prepare for and respond to the impacts of a changing climate.
Representative Data Products Used or Created:
Available through ORNL DAAC:
- AVIRIS Classic Data Portal*
- AVIRIS-NG Data Portal*
- MODIS Normalized Difference Vegetation Index Data, Smoothed and Gap-filled, for the Conterminous U.S.: 2000-2015
doi:10.3334/ORNLDAAC/1299
* These datasets currently are hosted by NASA's Jet Propulsion Laboratory (JPL). ORNL DAAC, the official archive for these products, is in the process of archiving them.
Other data products used:
- Community Land Model (CLM), National Center for Atmospheric Research
- CropScape, U.S. Department of Agriculture
- Ecological Spectral Information System (EcoSIS) Database
- Landsat, USGS National Land Cover Database
- MODIS/Terra and Aqua BRDF/Albedo Daily L3 Global—500m V006 (from NASA’s Land Processes DAAC)
doi:10.5067/MODIS/MCD43A3.006 - MODIS/Terra Leaf Area Index/FPAR 8-Day L4 Global 500m SIN Grid V006 (from NASA’s Land Processes DAAC)
doi:10.5067/MODIS/MYD15A2H.006 - MODIS Normalized Difference Vegetation Index (NDVI) at 250 Meters
doi:10.5067/MODIS/MOD13Q1.006 - National Ecological Observatory Network Airborne Observation Platform
- Pre-settlement Vegetation Cover, Michigan Department of Natural Resources Open Data GIS Layer
- Soil Moisture Active Passive (SMAP) L3 Radiometer Global Daily 36 km EASE-Grid Soil Moisture, Version 4 (from NASA’s National Snow and Ice Data Center DAAC)
Read about the Research:
Cavender-Bares, J., Schneider, F., Santos, M.J., Armstrong, A., Carnaval, A., Dahlin, K.M., Fatoyinbo, L., Hurtt, G.C., Schimel, D., Townsend, P.A., Ustin, S.L., Wang, Z., & Wilson, A.M. (2022). Integrating remote sensing with ecology and evolution to advance biodiversity conservation. Nature Ecology & Evolution. doi:10.1038/s41559-022-01702-5
Kamoske, A.G., Dahlin, K.M., Serbin, S.P., & Stark, S.C. (2021). Leaf traits and canopy structural heterogeneity together explain canopy functional diversity: Mapping whole canopy traits with a fusion of hyperspectral imagery and lidar. Ecological Applications, 31(2): e02230. doi:10.1002/eap.2230
Dahlin, K.M., Akanga, D., Lombardozzi, D.L., Reed, D.E., Shirkey, G., Lei, C., Abraha, M., & Chen, J. (2020). Challenging a global land surface model in a local socio-environmental system. Land, 9(398): 1-21. doi:10.3390/land9100398