User Profile: Laura Kurgan

Data from NASA’s SEDAC helps researchers like Professor Laura Kurgan study the ways in which urban spaces are structured, shaped, and transformed by conflict, and identify the ideological assumptions behind many data visualization projects.
Image
Laura Kurgan
Laura J Kurgan, Professor of Architecture at the Graduate School of Architecture Planning and Preservation (GSAPP) at Columbia University, where she directs the Center for Spatial Research (CSR). Image courtesy of CSR

Laura Kurgan, Professor of Architecture, Director Center for Spatial Research, Columbia University, Graduate School of Architecture, Planning and Preservation

Research Interests: Urban space and conflict; critical data visualization and mapping; environmental justice; spatial inequality.

Research Highlights: In the 1960s and 70s, Earth-observing satellites and the data they produced were primarily used to aid weather prediction and monitor environmental change, be it on land, in the surface waters of the ocean, or in the atmosphere. However, as satellite instrument technology advanced, and engineers developed more sophisticated ways of extracting information from the data provided by satellite instruments, the applications of satellite data have grown exponentially. So have the disciplines and fields that find it valuable. Today, the use of satellite data has gone beyond the domains of meteorologists, environmental scientists, and geographers, to include fields ranging from economics to epidemiology to history. Thus, in addition to following severe weather, ocean currents, and atmospheric pollutants, data from Earth-observing satellites are now used to track micro-plastics and commercial fishing fleets, survey gas flares and mining, and monitor urban sprawl and the spread of disease — and the list keeps growing.

Among those experts using remotely sensed data in new ways is Laura Kurgan, Professor of Architecture at the Graduate School of Architecture Planning and Preservation (GSAPP) at Columbia University, where she directs the Center for Spatial Research (CSR). An architect by training and, by her own admission, “not a data scientist,” Kurgan’s work uses spatial data to investigate political and social conflict, while also exploring the ethics and politics of digital mapping and the technologies used to create it.

“Urban data and, in particular, geo-spatial imagery, are essential for investigating the ways contemporary social and political space is built through contestation. But we need to work with them critically and reflectively, not take them for granted,” Kurgan said.
Image
Gridded_Pop_Count_SEDAC


Kurgan is a member of NASA's Socioeconomic Data and Applications Center (SEDAC) User Working Group (UWG) and, to conduct her research, she and her colleagues use datasets from SEDAC and a variety of other sources. SEDAC is one of the Distributed Active Archive Centers (or DAACs) in NASA’s Earth Observing System Data and Information System (EOSDIS) and it is operated by the Center for International Earth Science Information Network, a unit of the Earth Institute at Columbia University based at the Lamont-Doherty Earth Observatory in Palisades, New York. As part of its mission to synthesize Earth science and socioeconomic data and information for policymakers and applied science users, SEDAC archives, manages, and distributes the data, tools that pertain to both the earth and social sciences.

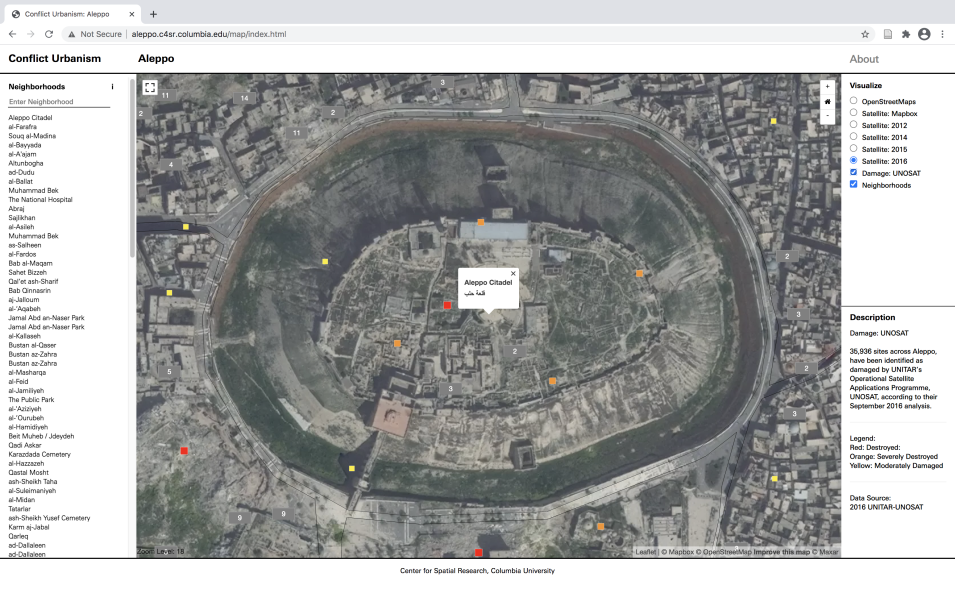
Kurgan’s recent work has centered around the notion of 'conflict urbanism,' which she defines as “an investigation of the ways in which urban spaces are structured, shaped, and transformed by conflict.” She is Principal Investigator on an ongoing project at the CSR titled Conflict Urbanism. In the first case study of the project, Conflict Urbanism: Aleppo, she and her colleagues built an open-source, interactive, layered map of the Syrian city of Aleppo at the neighborhood scale that allows users to navigate the city with the aid of high-resolution satellite imagery from before and during the civil war, and explore geo-located data about cultural sites, neighborhoods, and other areas damaged in the fighting. Yet, documenting the damage inflicted on the city during the war is only half the story. The map can also serve as a platform for collaborators, people both in and outside the city, to use for telling data-driven stories about Aleppo. Researchers added their perspectives and analyses to the website to broaden viewers’ understanding of what was happening in the city at the infrastructural, neighborhood, building, social, and cultural scales. The goal was to create what Kurgan refers to as “an active archive of the memory of destruction in Aleppo” through investigation and interpretation, up close and from a distance.

Image
landsat not borders or words
For each pair of images acquired 16 days apart, Kurgan and her colleagues recorded differences in pixel values across Aleppo. Changes in brightness of all infrastructures, such as roadways, runways, and bridges, vegetation, and buildings were mapped for each change pair. Buildings that experienced damage were often darker afterwards, and this shift is represented by a decline in panchromatic values. Sites of destroyed trees, on the other hand, often appeared brighter due to the removal of the dark tree canopy and exposure of the lighter ground underneath. Images courtesy of the Center for Spatial Research.

Part of that investigation from a distance involves an experimental approach in which Kurgan and her team, in collaboration with remote sensing analyst Jamon Van Den Hoek, Assistant Professor of Geography at Oregon State University, used Landsat imagery to make bi-weekly “change maps" of Aleppo that revealed and documented damage in the city.

“Using a method that is typically employed by remote sensing scientists to study ecological change, Prof. Van Den Hoek developed an algorithm that is trained on a different geography – urban Aleppo – so that we could ask a different set of questions. How might we remotely sense urban damage that is the result of war?” write Kurgan and her colleagues in the introduction to the “Remote Sensing Urban Damage” page of the website. “Using nearly two hundred open-access satellite images, we have mapped the spatiality and temporality of changes in pixel values of satellite images over Aleppo, offering a remotely collected record of significant change in Aleppo measured twice a month for the last 64 months.”


This method for documenting the changes to urban areas that occur in wartime inspired additional work by the CSR, and Kurgan is hopeful that it could inspire others, including journalists, and human rights advocates seeking new ways to visualize the changes taking place during conflicts on a day-to-day basis—or as she puts it, “to document the memory of destruction in urban war zones.” UNITAR (the United Nations Institute for Training and Research) does this kind of work "by hand," she says, "and with many eyes on high resolution imagery. Our hope was that this algorithm might automate some phases of this kind of work in the future, directing human eyes to the right places on high resolution satellite imagery."

In addition to developing new applications for existing remote sensing technologies, Kurgan is also interested in drawing attention to the conflicts in data visualizations themselves.

 
Image
Aleppo_Unosat-layer
A high-resolution satellite image of Aleppo in 2016. Such imagery is available in the map that is part of the Center for Spatial Research project, Conflict Urbanism: Aleppo. Image courtesy of the Center for Spatial Research

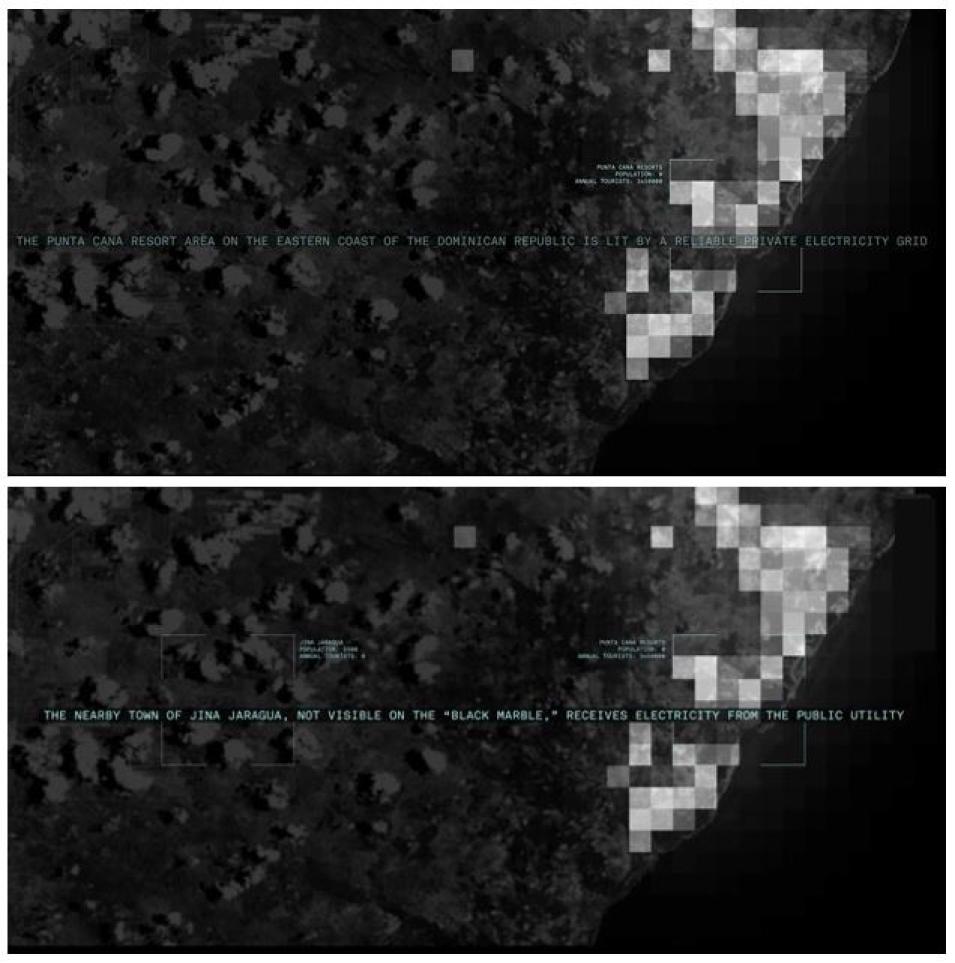
For example, Day/Night Band imagery from the Visible Infrared Imaging Radiometer Suite (VIIRS) instruments aboard the NASA-NOAA Suomi National Polar-orbiting Partnership and NOAA-20 satellites is frequently used to estimate population, assess economic development through the electrification of remote areas, and monitor disaster impact and recovery.” Yet, as Kurgan and her colleagues demonstrate in In Plain Sight — a video installation by the Center for Spatial Research, the design firm Diller Scofidio Renfro, and Robert Pietrusko of the Graduate School of Design at Harvard — the presence or absence of nighttime lights may not depict what one expects.

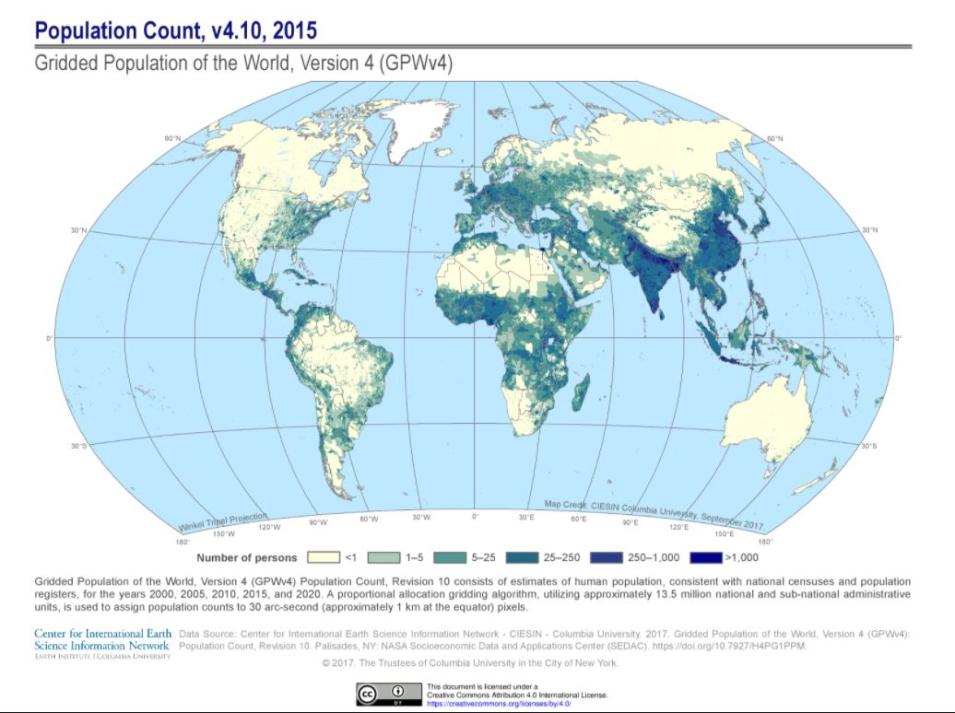
The video, exhibited at the Venice Architecture Biennale in 2018, begins with an image of the Earth rotating in space accompanied by text referencing the 1972 photograph known as the Blue Marble — the first-ever image of the Earth in space. Then it shows an image of the Black Marble, the NASA dataset that shows nighttime lights around the globe, as text informs viewers that, although “lights suggest concentrations of populations in cities and towns,” those suggestions don’t always materialize. By comparing and analyzing the discrepancies in the two datasets, the Gridded Population of the World (Version 4) and the Black Marble, the video goes on to explain to viewers that “The absence of light does not always mean the absence of people” and that “The presence of light does not always mean the presence of people.”

The video shows that, because nighttime light can only be seen at a resolution of one kilometer per pixel, it’s difficult to make any particular claims about a light source, or the presence of people, without additional information, such as high-resolution imagery and data on population density. To wit, viewers are shown several instances in which lights associated with infrastructure projects (e.g., mines and gas lines), military installations, and tourist areas appear in the Black Marble dataset, but nearby cities, towns, and villages—places that may lack electricity yet are home to thousands of people—do not.

In another example, the video shows viewers how, even in places where electricity is ubiquitous, “power remains unequally distributed.” After Hurricane Harvey, a category 4 storm, made landfall in Houston in 2017, the power was restored within 11 days. Conversely, after Hurricane Maria, another category 4 storm hit Puerto Rico in the same year, nearly 30 percent of households were still without power 120 days after the storm and, at the time the video was released a year later, the island was still subject to frequent power outages and island-wide blackouts. All of this leads the video’s creators to conclude, “The view of nighttime lights from space reveals a glaring truth on the ground: A world fractured by inequality.”

Image
Better Comparison
As Kurgan and her colleagues demonstrate in In Plain Sight, the absence of light doesn't always mean the absence of people and the presence of light doesn't always indicate the presence of people. For example, the top image shows the Punta Cana Resort area on the eastern coast of the Dominican Republic, which is served by a reliable private electricity grid. The lower image shows the nearby town of Jina Jaragua (to the left of the resort), which is not visible on the Black Marble imagery, as it received electricity from a less reliable public utility. Images courtesy of the Center for Spatial Research.


For Kurgan, the conclusions of In Plain Sight “challenge our assumptions about geographies of belonging and exclusion.”


Challenging the assumptions and getting the viewers and users of remotely sensed data to think critically about it is the aim of Kurgan’s work at the CSR, which brings together scholars, students, and others working at the nexus of architecture, urbanism, the humanities, and data science to “interrogate the world of big data” and open new areas of research pertaining to cities worldwide.

For Kurgan, this interdisciplinary approach—bringing architecture and sciences together—is critical for bringing the ideological aspects of data and data visualizations to the fore.

“Our projects generally involve collaborations with researchers and advocates across a variety of disciplines and institutions, working with them to communicate information clearly, critically, responsibly, and provocatively,” Kurgan and her colleagues write on the CSR website. “We are committed to rigorous and reliable work with data, to harnessing the most powerful techniques of design and visualization, and to a critical reflection on the limits and ideologies of both data and its representation.”


Representative Data Products Used or Created:

Available through SEDAC:

Other data products used:

Read about the Research:

Book:

Laura Kurgan, Close Up at a Distance: Mapping Technology Politics. Zone Books, 2013

Articles:

Aleppo, Syria: "Urban Destruction Beyond Winning the War" in Laura Kurgan and Dare Brawley, eds., Ways of Knowing Cities, NY: Columbia Books on Architecture and the City, 2019, pp 94 

Laura Kurgan, Dare Brawley, Jia Zhang, and Wendy Hui Kyong Chun, "Weak Ties: The Urban History of an Algorithm," e-flux: Are Friends Electric, October 2019 

"Mapping the New Politics of Care," a joint project of the Center for Spatial Research (GSAPP Columbia) and the Global Health Justice Partnership (Yale) to visualize the geographic allocation of health care workers and vaccine supplies in the COVID-19 pandemic in the U.S. Launched October 2020. 

Last Updated