Ocean Color
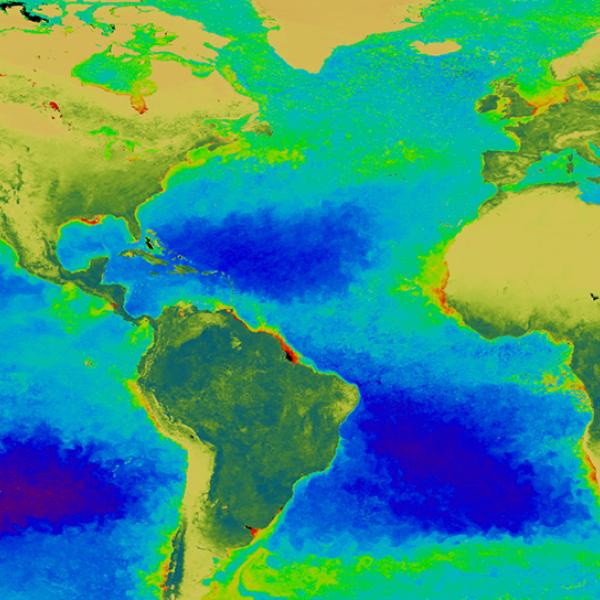
Ocean color is measured based on the amount of absorption by particles, (e.g., phytoplankton, sediments, CDOM) and in turn, the amount of water-leaving radiance. Having a quantitative measure of these parameters is useful in understanding how water bodies, such as the ocean, are evolving, as well as determining the quality of the water for consumption by living organisms. The primary means of measuring ocean color from space is through Landsat, the Terra and Aqua satellites, the joint NASA/NOAA Suomi National Polar-orbiting Partnership (Suomi NPP), and ESA's suite of Sentinel missions. Each of these satellites has sensors acquiring data at different spatial, temporal, spectral, and radiometric resolutions.
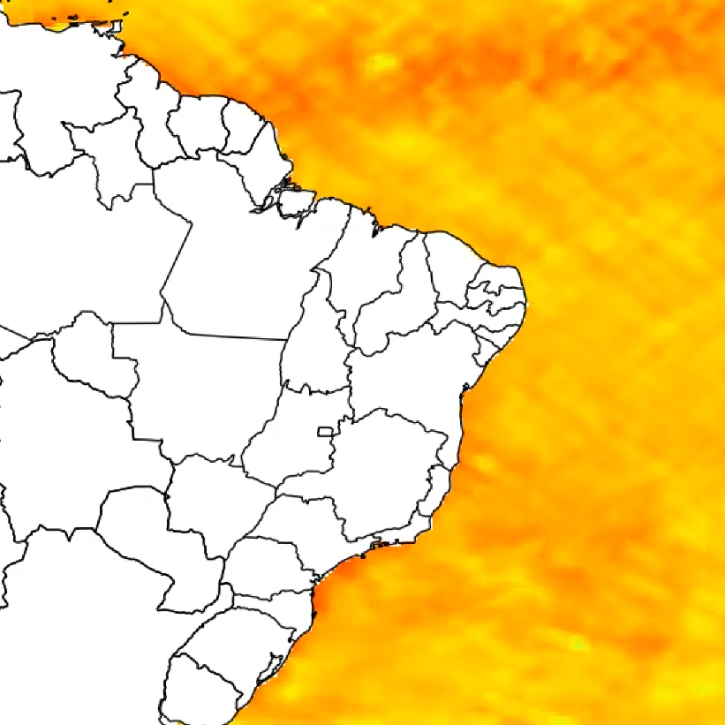
In addition to Ocean Color, sea surface temperature (SST) is a valuable parameter as warmer waters can contribute to the growth of algal blooms. However, in the ocean cold upwelling waters usually bring nutrients from the seafloor fueling marine phytoplankton blooms. In the MODIS and VIIRS data, there is also an inherent optical properties (IOP) file, which provides an estimate of reflectance by CDOM. Specifically, the adg_443_giop is the absorption coefficient of non-algal material plus CDOM.
For more information on the algorithm used to generate this product and others, view the OB.DAAC algorithm descriptions.
Research-quality (higher-level "standard") data products can be accessed via Earthdata Search or through NASA partner websites:
- Landsat Data from USGS Earth Explorer
Landsat is a joint NASA/USGS program that provides the longest continuous space-based record of Earth's land in existence. On the Earth Explorer site, specify your search criteria, then:- select "Data Sets"
- select Landsat
- Select Landsat Collection 1 Level-1
- Select Landsat 7 and/or Landsat 8
These files can be downloaded as Level-1 Data Products in GeoTIFF format. Note that you will need a USGS login to proceed and that you will need to atmospherically correct the image. Acolite is one free tool that performs this correction. FLAASH is a function in the ENVI image processing program that also performs this correction. SeaDAS will convert Level 1 Landsat to Level 2 once atmospheric correction has been done.
- MODIS Ocean Color level 2 data from Earthdata Search
MODIS IOP level 2 data from Earthdata Search
Terra/MODIS SST level 2 data from Earthdata Search
All of the above datasets are available in NetCDF format, and can be opened with SeaDAS or other NASA-developed tools (see Tools for Data Access and Visualization section).
- VIIRS Ocean Color level 2 data from Earthdata Search
VIIRS IOP level 2 data from Earthdata Search
VIIRS SST level 2 data from Earthdata Search
All of the above datasets are available in NetCDF format, and can be opened with SeaDAS or other NASA-developed tools (see Tools for Data Access and Visualization).
- Sentinel-3 OLCI data from Earthdata Search
Data are available in NetCDF format within zip files. - Level 1 and 2 data from OB.DAAC
Algorithms are available through the SeaDAS program to derive ocean color products from this Level 1 and 2 data, if needed.
Just recently, NASA began acquiring ocean color data from a series of small Cubesats, cube-shaped satellites (also known as a nanosatellites). The SeaHawk mission HawkEye instrument captures images of the ocean and Earth with 120-meter-per-pixel resolution. High resolution datasets can be accessed through NASA's OB.DAAC, where users can search for imagery by date range or location. When searching by location, users have the option to click on a map, entering latitude and longitude coordinates, or select a location from a list of locations and regions. Once a location is selected, users will receive information about swaths and the number of available images. When users click on an image, they will be provided with a true color and derived chlorophyll browse images of the scene and given options for downloading level-1 and level-2 data.. For more information on the mission, view SeaHawk Mission Proves CubeSats Are a Viable Option for Collecting Credible Scientific Data.
Data products can be visualized as a time-averaged map, an animation, seasonal maps, scatter plots, or a time series through an online interactive tool called Giovanni. Follow these steps to plot data in Giovanni: 1) Select a map plot type. 2) Select a date range. Data are in multiple temporal resolutions, so be sure to note the start and end date to ensure you access the desired dataset. 3) Check the box of the variable in the left column that you would like to include and then plot the data. For more information on choosing a type of plot, see the Giovanni User Manual.
- Level 3 data products from OB.DAAC
Data products include chlorophyll-a concentration, SST, reflectance, and other related measurements from MODIS and VIIRS at 4 km and 9 km resolution. These data products are provided in five temporal resolutions: daily, 8-day, monthly, seasonally, and annually. - Aqua MODIS Chlorophyll-a Concentration data from Giovanni
Data products from MODIS on the Aqua satellite at 4 km resolution provided at both 8-day and monthly temporal resolutions. - Aqua MODIS SST data from Giovanni
Data products from MODIS on the Aqua satellite at 4 km resolution provided at both 8-day and monthly temporal resolutions.
NRT data can be accessed via Worldview:
Freshwater Lakes
Monitoring ocean color in freshwater lakes is critical as assessing cyanobacteria, pathogens such as E.coli, man-made pollutants, nutrient inputs, and water clarity have implications for drinking water for humans and domestic animals, wildlife, and other ecosystems. Because these water bodies tend to be smaller and are surrounded by land, it is imperative to look at the sensor qualities before deciding which one to use.
The size of the water body must be considered. For large lakes like Lake Victoria or one of the Great Lakes, MODIS and VIIRS data are adequate. They provide a coarser spatial resolution but a more frequent temporal resolution, which is useful in a dynamic system. For small lakes, Landsat and Sentinel are needed as they provide the fine spatial resolution needed, but note that the temporal resolution is coarse, allowing for only monthly and seasonal monitoring.
In SeaDAS, converting the data of inland water bodies from Level 1 to Level 2 requires modification of the algorithm criteria. It is often more effective to turn off aerosol subtraction, as well as cloud, tilt, and land masks due to the algorithm resolution. For more information, check out NASA's Applied Remote Sensing Training (ARSET) Program webinars, Integrating Remote Sensing into a Water Quality Monitoring Program, Part 2, and Processing Satellite Imagery for Monitoring Water Quality.
In-situ Data
In-situ data are easily integrated within SeaDAS and are available through SeaBASS. SeaBASS contains in-situ measurements of apparent and inherent optical properties, phytoplankton pigment concentrations, and other oceanographic and atmospheric data.
If you are planning to collect your own in-situ data timed to when the satellite passes over your location, use the Overpass Prediction Tool.
The Bio-Optical in situ Data Discovery and Access with SeaBASS webinar covers how SeaBASS can be leveraged for data search, discovery, and access, and will demonstrate how SeaBASS supports NASA's ocean color satellite products and the broader scientific community.