Matter in Motion: Earth's Changing Gravity

A new satellite mission sheds light on Earth's gravity field and provides clues about changing sea levels.
author-share

According to legend, Isaac Newton discovered gravity after watching an apple fall from a tree. Using the word "gravitas" (Latin for "weight"), he described the fundamental force that keeps objects anchored to the Earth. Since then, scientists have used maps of the Earth's gravity to design drainage systems, lay out road networks, and survey land surfaces. But Newton probably didn't imagine that gravity could reveal new information about the global hydrology cycle.

Traditionally, scientists constructed gravity maps using a combination of land measurements, ship records, and more recently, remote sensing. However, those measurements weren't accurate enough to capture the slight changes in water movement that cause gravity to vary over time. With the help of a new satellite mission, scientists can now weigh water as it circulates around the globe and relate these measurements to changes in sea level, soil moisture, and ice sheets.

To better assess these gravity variations, an international team of engineers and scientists developed the Gravity Recovery and Climate Experiment (GRACE) mission. Launched in March 2002 as a joint venture between NASA and the Deutsches Zentrum fuer Luft und Raumfahrt (German Aerospace Center), the mission was implemented through collaboration between the University of Texas Center for Space Research, the GeoforschungZentrum (Germany's National Research Centre for Geosciences), and the NASA Jet Propulsion Laboratory (JPL).


Image
GRACE image
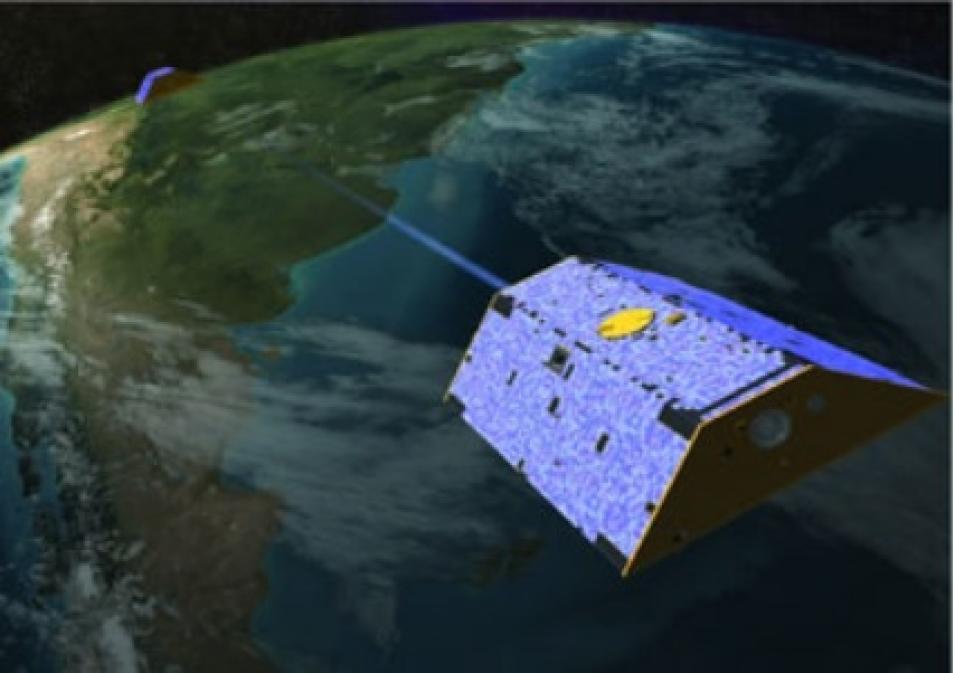
By measuring changes in the distance between the GRACE mission's lead satellite and trailing satellite, scientists can determine changes in the Earth's gravity. (Image courtesy of NASA Jet Propulsion Laboratory)

GRACE relies on two identical satellites, each about the size of a car. As the satellites fly approximately 220 kilometers (137 miles) apart, one following the other, a microwave ranging system monitors the distance between them to within a micron -- smaller than a red blood cell. Scientists can map gravity anywhere on the Earth's surface by measuring tiny changes in distance between the two satellites as each of them speeds up and slows down in response to gravitational force.

Archived at NASA's Physical Oceanography Distributed Active Archive Center (PO.DAAC) in Pasadena, California, and the GeoForschungZentrum Information System and Data Center (GFZ/ISDC), GRACE data are changing the way scientists and modelers view gravity. GRACE provides monthly maps that are at least 100 times more accurate than previous maps at detailing changes in the Earth's gravity field. "The classic idea of gravity being something that you measure once is no longer accepted. Gravity is an element that scientists must continue to monitor," said Byron Tapley, director of the Center for Space Research and principal investigator for the GRACE mission.

Because scientists can't see, feel, or directly observe gravitational forces, they map the Earth's gravity using a mathematical model that describes an imaginary spherical surface called the geoid. The geoid represents oceans as smooth, continuous surfaces unaffected by tides, winds, or currents. It creates a locally horizontal surface against which scientists can measure the downward pull of gravity.

Gravity is determined by how much mass a given material has, so the more mass an object has, the stronger its gravitational pull. For example, granite is a very dense material with a high level of mass, so it will exert a greater pull than the same volume of a less dense material, such as water. Earth's mass is distributed between various landforms and features -- such as mountain ranges, oceans, and deep sea trenches -- that all have different mass, which creates an uneven gravity field.


Image
GRACE gravity field map
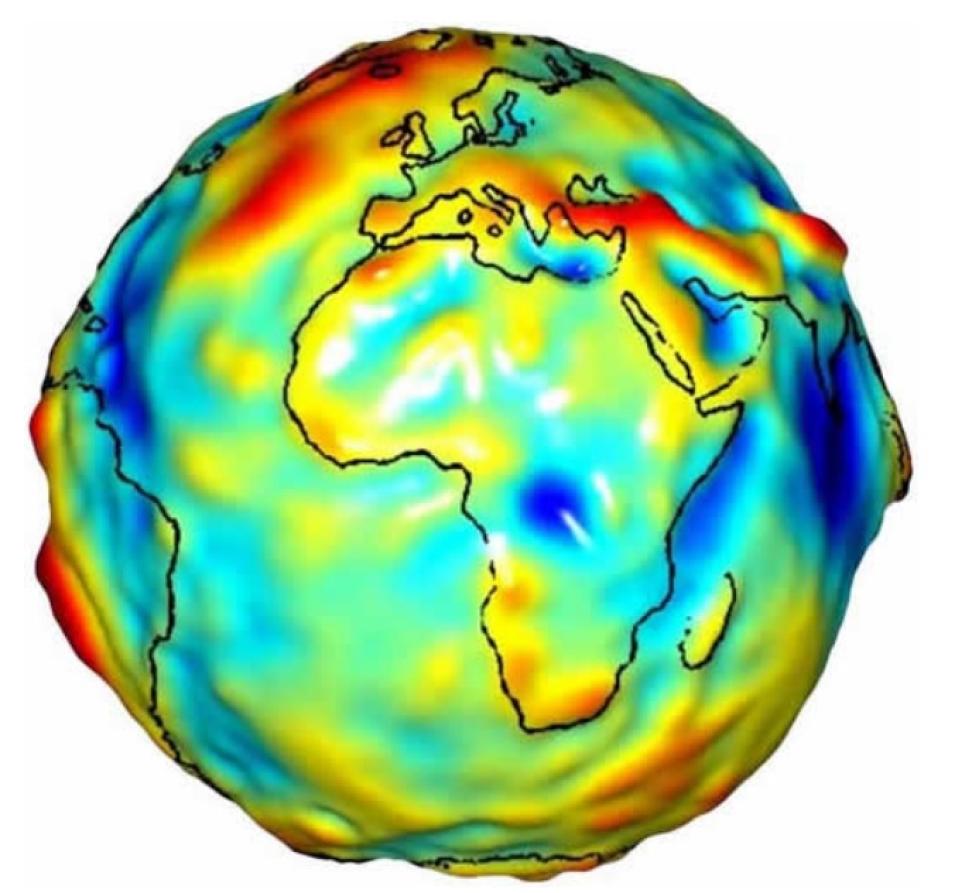
This map, created using data from the Gravity Recovery and Climate Experiment (GRACE) mission, reveals variations in the Earth's gravity field. Dark blue areas show areas with lower than normal gravity, such as the Indian Ocean (far right of image) and the Congo river basin in Africa. Dark red areas indicate areas with higher than normal gravity. The long red bump protruding from the lower left side of the image indicates the Andes Mountains in South America, while the red bump on the upper right side of the image indicates the Himalayan mountains in Asia. (Image prepared by The University of Texas Center for Space Research as part of a collaborative data analysis effort with the NASA Jet Propulsion Laboratory and the GeoForschungsZentrum in Potsdam, Germany)

Consequently, the geoid doesn't form a perfect sphere, and in maps based on the geoid, the Earth's gravity field exhibits bulges and depressions. "Because the distribution of materials deep inside the Earth varies, its gravity field has hills and valleys. The ocean tries to lay along that hilly surface," said Michael Watkins, GRACE project scientist at JPL. For instance, the ocean surface off the tip of India is about 200 meters (650 feet) closer to the Earth's core than the ocean surface near Borneo. Without tides, currents, and wind, the ocean surface would follow the hills and valleys of the geoid, reflecting the variations in the strength of Earth's gravitational force.

"The Earth's gravity field changes from one month to the next mostly due to the mass of water moving around on the surface," said Watkins. "Because water in all its forms has mass and weight, we can actually weigh the ocean moving around. We can weigh rainfall, and we can weigh changes in the polar ice caps."


Image
hydrologic cycle
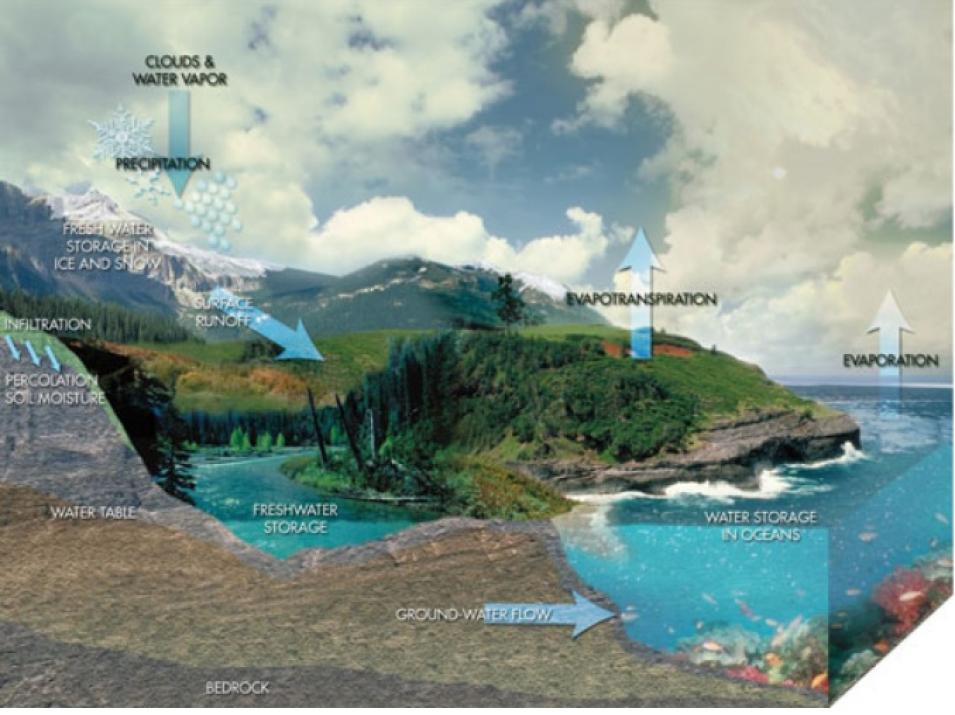
This diagram illustrates the hydrologic cycle and shows how water circulates over, under, and above the Earth’s surface. GRACE data may lead to the identification of new fresh water sources in arid regions on the Earth. (Image courtesy of NASA Goddard Space Flight Center)

GRACE observes the Earth's hydrologic cycle and allows scientists to track water as it evaporates into the atmosphere, falls on land in the form of rainfall or snow, or runs off into the ocean. "The biggest freshwater hydrologic events that GRACE detects are the rainfall runoff in the larger river basins, like the Amazon, and the monsoon cycle in India," said Tapley.

Detecting how much water is entering the oceans is key to learning about sea level changes. Other remote sensing instruments can observe sea level change, but they can't discriminate between thermal expansion (when warmer water expands) and additional mass in the form of water being added to the ocean. "GRACE is sensitive only to the portion of sea level change that is due to water mass being added," said Don Chambers, research scientist at the Center for Space Research. "Most models assume that the total mass of the ocean is constant -- that there is no water being added to it or taken away. With GRACE measurements, modelers will need to account for fluctuations in mass."

Developing a more accurate account of sea level change is important for low-lying countries such as Tuvalu. Situated in the Pacific Ocean between Hawaii and Australia, the country is a combination of nine islands and atolls (ring-like coral islands that enclose a lagoon). But because the islands reach a mere 5 meters (16 feet) above sea level at their highest point, they are vulnerable to rising oceans. GRACE data can reveal long-term climate trends that may affect sea level changes.

In addition to gauging changes in water mass on the Earth's surface, GRACE can detect large-scale moisture changes underground. For instance, during record heat waves in Russia in 2002 and Europe in 2003, GRACE data enabled scientists to measure the amount of moisture that evaporated from the soil during those very dry periods. This ability will also alert hydrologists to changes in aquifers and underground water supplies. "It's very hard to measure how much water is deep in the ground and how much it changes from one year to the next. GRACE is one of the few tools we have to do that," said Watkins. "It can help us understand local hydrology, evapotranspiration, precipitation, and river runoff, and it can give us an idea of how much water is available deep in the Earth for irrigation and agriculture," said Watkins.


Image
Aitutaki Cook Islands
Like many atolls in the Pacific Ocean, Aitutaki in the Cook Islands rises only a few meters above sea level. Several island nations, such as Tuvalu in the Pacific Ocean and the Maldives in the Indian Ocean, are composed entirely of low-lying islands and atolls, making them especially vulnerable to rising sea levels. (Image courtesy of Laurie J. Schmidt)

Scientists are also using GRACE data to survey frozen water in the form of ice sheets and large glaciers. Isabella Velicogna, a research scientist at the University of Colorado, studies mass changes in the Greenland ice sheet. "Some components of the seasonal cycle in Greenland are not very well understood, like ice discharge and subglacial hydrology. GRACE sees some of these components that are difficult to measure," she said. Other instruments, such as altimeters, can determine elevation changes in the ice sheet, but GRACE sees the total mass, alerting scientists to how much ice and water are draining off the ice sheet. "GRACE provides information that you can't get from any other satellite instrument," said Velicogna.

After analyzing two years of data, Velicogna reported a longer-term trend: the ice sheet is losing mass. Although other Greenland research supports this finding, she added that scientists need a longer time series of data to understand what is happening to the ice sheet. Greenland holds about 2,600,000 cubic kilometers (624,000 cubic miles) of ice, which, if melted, would result in a sea level rise of about 6.5 meters (22 feet). Since the late nineteenth century, melting ice sheets and glaciers have increased global sea level by about 1 to 2 centimeters (0.3 to 0.7 inches) per decade.

Even glaciers that melted long ago affect sea level today. For instance, a large mass of ice covered the Hudson Bay area during the last Ice Age, which ended around 15,000 years ago. Now, without the weight of glaciers, the land beneath that area is slowly rebounding at a rate of about 1 centimeter (0.3 inch) per year. Over time, this postglacial rebound affects regional coastlines, complicating tide gauge readings and making it harder to monitor changes in global sea level. GRACE data will allow scientists to measure the change that can be attributed to postglacial rebound, making it easier to determine how much other factors -- such as global warming -- contribute to rising sea levels.

Investigators designed GRACE as a five-year mission, but scientists hope to gather data for up to 10 years. Continuing the mission life will allow them to explore new applications for GRACE data. "We're combining gravity measurements with other data, like those from ice sheet altimetry or radar altimetry. But we're still trying to understand what all these data tell us," said Watkins. "It's a very impressive engineering accomplishment that allows us to make such detailed measurements. GRACE gives us high-resolution gravity mapping - it's a pioneering remote sensing tool."

References

Tapley, B.D., S. Bettadpur, M. Watkins, and C. Reigber. 2004. The gravity recovery and climate experiment: mission overview and early results. Geophysical Research Letters, 31, L09607, doi:10.1029/2004GL019920.

Chambers, D.P., J. Wahr, and R.S. Nerem. 2004. Preliminary observations of global ocean mass variations with GRACE. Geophysical Research Letters, 31, L13310, doi:10.1029/2004GL020461.

For more information

NASA Physical Oceanography Distributed Active Archive Center (PO.DAAC)

Gravity Recovery and Climate Experiment (GRACE) website

GRACE fact sheet

GRACE Space Twins Set to Team up to Track Earth's Water and Gravity

About the remote sensing data used
Satellite Gravity Recovery and Climate Experiment (GRACE)
Parameter gravity variations
DAAC NASA Physical Oceanography Distributed Active Archive Center (PO.DAAC)
Last Updated