Seeing the City for the Trees

Researchers map vegetation and analyze the heat island effect in the urban landscape.
author-share

When most people think of islands, they imagine sunny beaches and palm trees, not sweltering summer days and polluted air. But hot, smoggy cities often become what scientists call "urban heat islands," where the air temperature can be 1 to 4 degrees Celsius (about 2 to 8 degrees Fahrenheit) warmer than surrounding rural areas.

Urban heat islands occur because cities tend to have large areas of dark roofing and paving material that absorb instead of reflect sunlight, causing surface and air temperatures to rise. Higher temperatures, in combination with air pollutants emitted by cars and industrial facilities, spur chemical reactions in the air that lead to more intense concentrations of ground-level ozone, which is the main ingredient in smog.

Higher temperatures and smog are more than just inconveniences to city dwellers; they can be a health hazard. But to understand how urbanization contributes to the heat island effect, scientists must analyze the urban landscape.

Dale Quattrochi, geographer and senior research scientist at the Marshall Space Flight Center, studies the urban heat island effect in Atlanta. Using data from NASA's Advanced Thermal and Land Application Sensor (ATLAS), flown onboard a Lear jet, Quattrochi measured temperatures across Atlanta. He then analyzed Landsat satellite data, obtained from NASA's Land Processes Distributed Active Archive Center (LP DAAC), to study the city's land cover patterns.

Quattrochi found that Atlanta's dramatic growth and extensive land cover change over the past few decades exacerbated the heat island effect. Landsat images of metropolitan Atlanta between 1973 and 1992 revealed that developers had cleared almost 380,000 acres of trees, replacing them with retail centers, roads, and about 270,000 acres of tract housing. Landsat data also revealed that an additional 180,000 acres of trees were cleared between 1993 and 1999.

Quattrochi's advice to city managers? Plant more trees. Trees and other vegetation help alleviate the urban heat island effect by providing shade, intercepting solar energy, cooling the air, and reducing air pollution.

While Quattrochi admits that shade is mostly a local effect, he stresses the importance of urban forests, or large collections of trees, such as those found in parks. Aside from providing large areas of shade, "The urban forest intercepts a significant amount of solar energy that would otherwise be used to heat up non-natural urban surfaces," he said.

When trees absorb sunlight, they don't heat up like urban materials do. In fact, trees transform solar energy into cool air through a process called evapotranspiration. Trees transpire, or release, water through pores in their leaves, and sunlight helps evaporate this water from the leaf surface. In other words, trees "sweat" to cool off, just like people do.

Trees also improve air quality by absorbing air pollutants such as sulfur dioxide and carbon monoxide. But not just any tree will do. Trees like oak and sycamore emit higher amounts of biogenic volatile organic compounds (BVOCs). BVOCs are naturally occurring pollutants that contribute to the development of ground-level ozone. Planting trees such as maple and elm, which are low BVOC emitters, can improve a city's air quality more effectively than high BVOC emitting trees.

Besides planting trees, cities can also "lighten up" and reduce the amount of dark surfaces that absorb heat. "A number of roofing companies are very proactive in Atlanta, and they're trying to use highly reflective roofing materials for warehouses and other buildings with very large square footage," said Quattrochi. Chicago and Atlanta are also starting to use reflective roofing for new construction.

Other cities have initiated the planting of rooftop gardens on city buildings to help cool the urban surface. Rooftop gardens insulate buildings and reduce energy consumption by intercepting solar energy that would otherwise heat the roof surface. And because rooftop gardens are irrigated, evapotranspiration helps cool the air.

Although Quattrochi's studies have focused on individual cities, the ATLAS sensor that he relied on for local data collection has become too costly to use. Quattrochi now expects to build on the archive of ATLAS data with remote sensing data from the Landsat and Quickbird satellites, as well as from NASA's Moderate Resolution Imaging Spectroradiometer (MODIS) sensor to monitor urban vegetation and land cover changes in metropolitan areas.
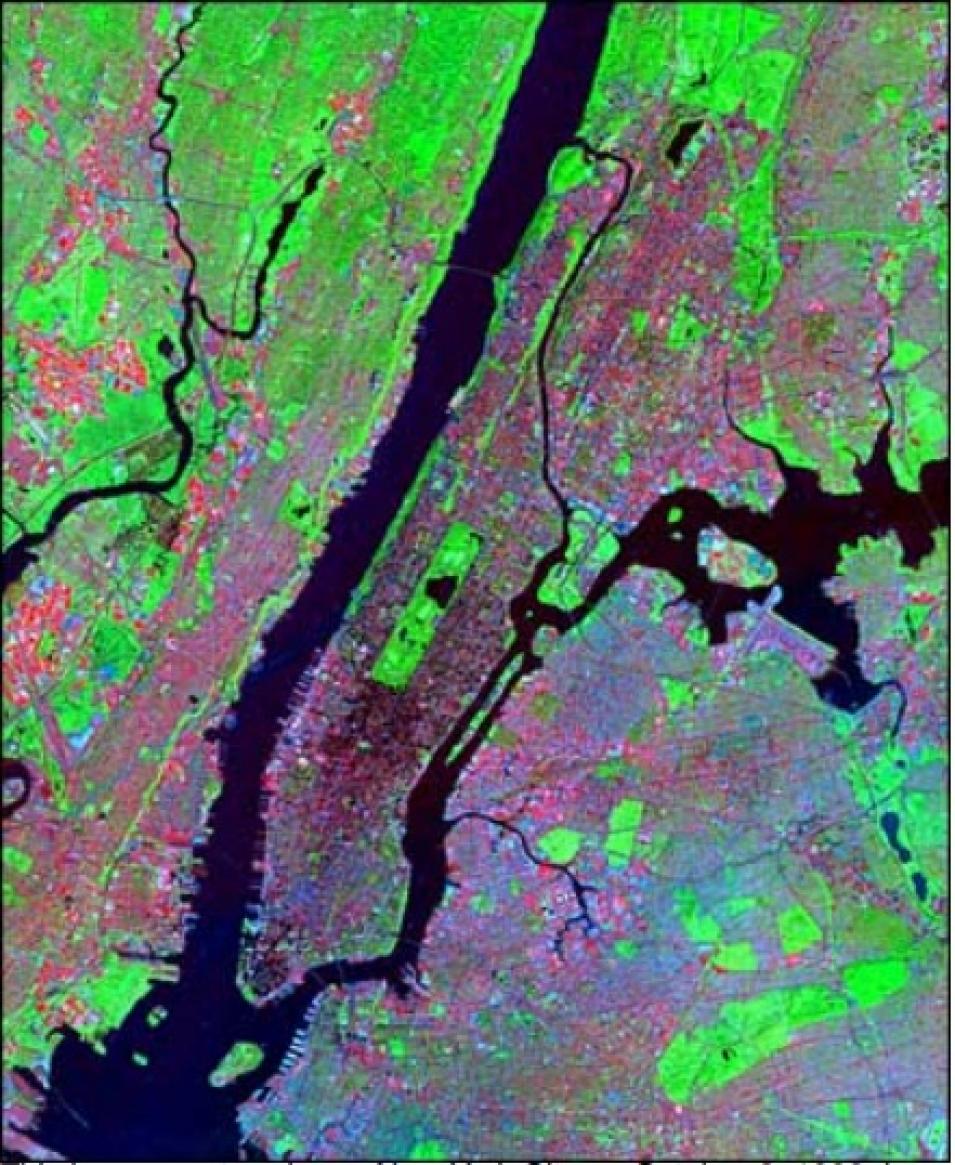
 

Image
This image captured over New York City on October 2, 1999, is a false color composite combining surface temperature and vegetation abundance information. Red indicates surface temperature, green indicates vegetation abundance, and blue indicates visible brightness. Red and pink areas are characterized by higher surface temperatures and lower vegetation abundances. Green and yellow areas are characterized by higher vegetation abundances and lower surface temperatures. Blue and black areas have lower surface temperatures and little or no vegetation. (Image courtesy of Chris Small, Lamont-Doherty Earth Observatory, Columbia University)

Mapping the abundance and distribution of vegetation in cities with satellites presents its own unique challenges. Remote sensing techniques usually rely on thematic classification, which involves assigning a single general land cover type (vegetation, water, urban area, etc.) to each pixel in an image. But because pixels classified as urban area may contain significant portions of vegetation, and vice versa, misclassification of mixed pixels can cause scientists to inaccurately map an urban area. In addition, how different classes of land cover are defined may be specific to a particular city or study, so the criteria can't reliably be applied to other urban areas.

Chris Small, research scientist at Columbia University's Lamont-Doherty Earth Observatory and project scientist at NASA's Socioeconomic Data and Applications Center (SEDAC), is using an approach designed for broader application.

Using Landsat data, Small and his colleagues are developing a model based on three categories of physical properties common to all urban environments: vegetation (usually trees), dark surface (deep shadow, asphalt, and other materials that absorb sunlight), and bright substrate (soil, concrete, and other reflective materials).

Landsat measures light reflected by and emitted from the Earth. The method Small is using, called Spectral Mixture Analysis, involves using Landsat data to divide urban land cover into these three categories. For most satellite data, the smallest unit of measurement is usually a pixel. But by running each pixel's reflectance characteristics through a computer model, Small can break a pixel down into fractions based on how each category reflects or absorbs light.

Spectral Mixture Analysis allows "mixed" pixels that can contain more than one class of land cover, reducing misclassification and allowing scientists to more accurately map the amount and distribution of vegetation in relation to urban building materials. This method represents an improvement over thematic classification, in which pixels must be classified as one type, even if they contain another type of land cover. "Instead of lumping a variety of different surface types into one thematic class and assigning one single value to that area, we're using Spectral Mixture Analysis to estimate fractions of urban land cover types," said Small.

To study vegetation in a number of cities around the world, Small and his colleagues at the SEDAC used Landsat data from LP DAAC and the Global Land Cover Facility, as well as data from commercial satellites such as Quickbird and Ikonos.

Relying on Landsat data, Spectral Mixture Analysis proved consistently effective at mapping urban vegetation, regardless of the city, making it flexible and broadly applicable. "Compared to many other types of urban data, the big advantage of Landsat is that it works exactly the same way over every place in the world," said Small.

An urban mapping technique based on satellite data that provides continuous coverage will allow city managers to observe changes in urban land cover over time to see whether growth patterns in their cities are alleviating or exacerbating the urban heat island effect.

For example, the New York City Parks Department is now using Landsat-derived vegetation maps to study vegetation changes in the New York metropolitan area.

"Now we can investigate whether tree cover is increasing or decreasing in various neighborhoods. Spectral Mixture Analysis gives us a simple and systematic way to look at total forest loss in a city,"

Small said. Small added that vegetation maps may help city managers monitor re-vegetation efforts, such as when a community plants or preserves trees, or when vacant land begins to support plant life again. Conversely, city managers could also watch for vegetation loss, which tends to occur when urban areas spread and replace natural vegetation.

Although Small and Quattrochi are using different approaches to monitor how vegetation changes impact the urban environment, they agree that understanding the urban heat island effect is a priority for many cities. According to recent United Nations estimates, at least 47 percent of the world's population currently lives in urban areas, and that percentage is expected to grow dramatically in the next few decades. Understanding the urban environment will become crucial to managing growth and mitigating the urban heat island effect. "We can begin to compare different cities, look at growth patterns, and hopefully provide a way for city managers to study their own regions," said Small.

References

Project Atlanta [4]. Accessed June 2, 2004.

Small, Christopher. In press. Mapping urban land cover with Landsat. International Journal of Remote Sensing.

Small, Christopher. 2003. High Spatial resolution spectral mixture analysis of urban reflectance. Remote Sensing of the Environment. 88:170-186.

World Urbanization Prospects: The 2001 Revision [5]. Accessed January 21, 2004.

For more information

NASA Land Processes Distributed Active Archive Center (LP DAAC)

NASA Socioeconomic Data and Applications Center (SEDAC)

SEDAC Urban Remote Sensing

Urban Remote Sensing

About the remote sensing data used
Data ATLAS Landsat MODIS Spectral Mixture Analysis
Parameter urban land cover urban land cover
DAAC NASA Land Processes Distributed Active Archive Center (LP DAAC) NASA Socioeconomic Data and Applications Center (SEDAC)
Last Updated