The Power of Particles

Can smoke spark severe tornadoes?
author-share

Early one April morning, a Yucatán farmer stooped over the stubble of his sugar cane field to set it on fire. Torching it would make a bed of rich ash for new seedlings. The smell of burning plant matter stung his nose as a great plume of smoke and soot rose up in the wind.

Just a few days later, a massive tornado tracked across Tuscaloosa, Alabama. Along with smoke particles, the wind carried all manner of debris: roofs and siding stripped from houses, uprooted trees, even SUVs and boats. A curtain of falling debris stretched across the sky for over 20 miles. A total of 122 tornadoes spun through the southeastern United States on April 27, 2011, killing 313 people, one of the deadliest outbreaks in U.S. history.

Were these two events connected? At the National Center for Atmospheric Research (NCAR) in Colorado, researcher Pablo Saide squinted at satellite images taken that week in April 2011. He spotted the giant smoke plume heading from the Yucatán towards the United States. Like other scientists, he had suspected a connection between yearly field-clearing fires in the Yucatán and South America, and severe tornadoes in the southeastern United States. If he could show how they were connected, information on smoke could be added to severe weather forecasts to help save lives.
Image
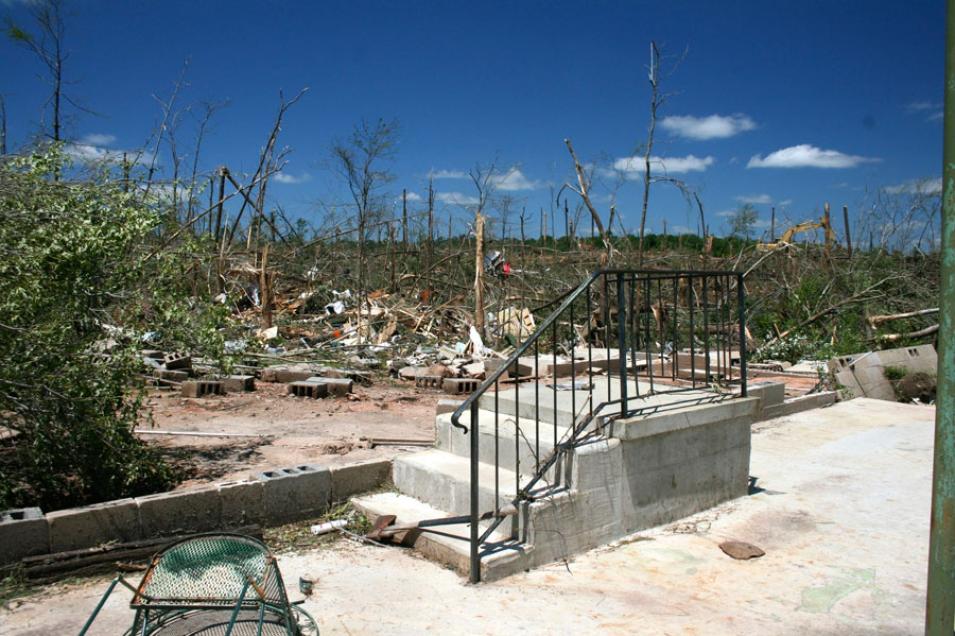
Photograph of devastation after a tornado hit Lake Martin, Alabama
Stairs and stripped trees are about all that remain after a tornado hit Lake Martin, Alabama, on April 27, 2011. (Courtesy lakemartinvoice/Flickr)

A meeting of masses

Scientists have long understood that smoke can intensify severe weather by increasing cloudiness, thunderstorm cloud heights, and lightning. But how smoke might worsen tornado outbreaks was not well understood, so weather forecast models could not use the smoke information to help predict dangerous conditions.

Tornadoes form when two different air masses meet during powerful storms. Under these conditions, cold air can trap warm air. With nowhere to rise, the warm air begins to spin. Sunlight pierces the storm clouds here and there, heating still more air on the ground. Energy builds, until eventually the spinning air mass has enough pent-up energy to bust through the cold air barrier and shoot skyward.

This happens over the southeastern United States each spring and summer as warm, wet air from the Gulf of Mexico meets cold, dry air from Canada. Scientists thought that tiny smoke and soot particles, or aerosols, influence convection by suppressing rain and causing more updraft, suggesting a connection to severe storms. But had this been seen in actual events?


Image
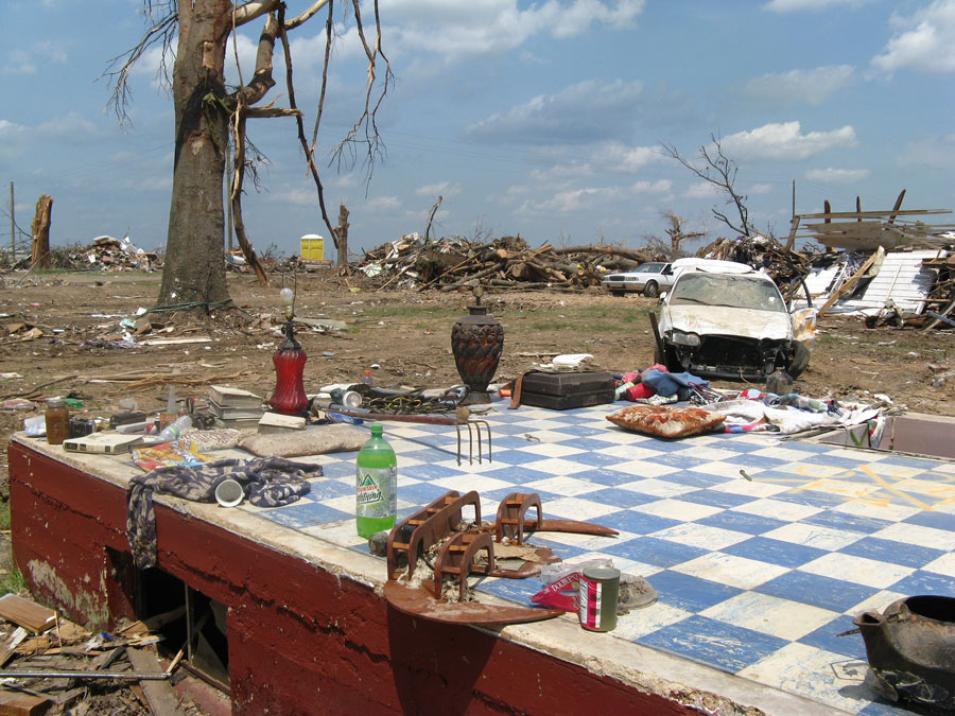
Photograph of devastation after a tornado hit Hackleburg, Alabama
Salvaged possessions sit on the foundation where a house once stood in Hackleburg, Alabama following a tornado that ripped through the town on April 27, 2011. (Courtesy C. Manning/American Red Cross/Flickr)

Smoke signals

Saide traced the plume northward over the Gulf of Mexico, but it stopped short of the outbreak. He was looking for bright clouds. Aerosols like smoke and dust reflect and absorb sunlight, and even attract cloud droplets. This can make clouds brighter and affect temperature and wind. Brighter clouds mean less sunlight reaches the ground and more is scattered back into the atmosphere. These interactions get complicated quickly and are what scientists call feedback, clues to atmospheric behavior.

The images showed how much light was being scattered and absorbed by particles. Moderate Resolution Imaging Spectroradiometer (MODIS) sensors on NASA's Terra and Aqua satellites had spied through a clear atmosphere to capture the aerosols and bright clouds that week in 2011. Yet MODIS sensors have a limited ability to see through clouds, and stormy conditions over the southeastern United States obscured their view of the lower atmosphere. Saide said, “When you have a tornado outbreak, you have a lot of clouds. But you need a clear sky to see the aerosols in the satellite data.”

Hunting for smoke, Saide and his colleagues inspected fire emissions data, also from MODIS, on those days. Cloud thickness measurements revealed how much light was passing through the clouds instead of being reflected. A lot of smoke and soot had been pumped into the atmosphere, but more was needed to track the plume. Plume heights from the Cloud-Aerosol Lidar and Infrared Pathfinder Satellite Observation (CALIPSO) satellite helped create a clearer signal of the smoke. And measurements taken from the ground confirmed what the satellites had seen. Saide said, “We used a lot of data to figure out where the fires were. We really needed to get the particles right to have the feedback be accurate.”

All that data meant they could simulate the conditions on the days leading up to the April 27 outbreak. Did the smoke reach the southeastern United States? Saide said, “In the model world you can turn off and on different processes, so we ran a couple of simulations, one with smoke and one without.” Comparing the two made it clear that smoke was changing conditions as it traveled to the scene of the outbreak. But it did not get them close enough to the tornadoes.

The tracks of our twisters

Image
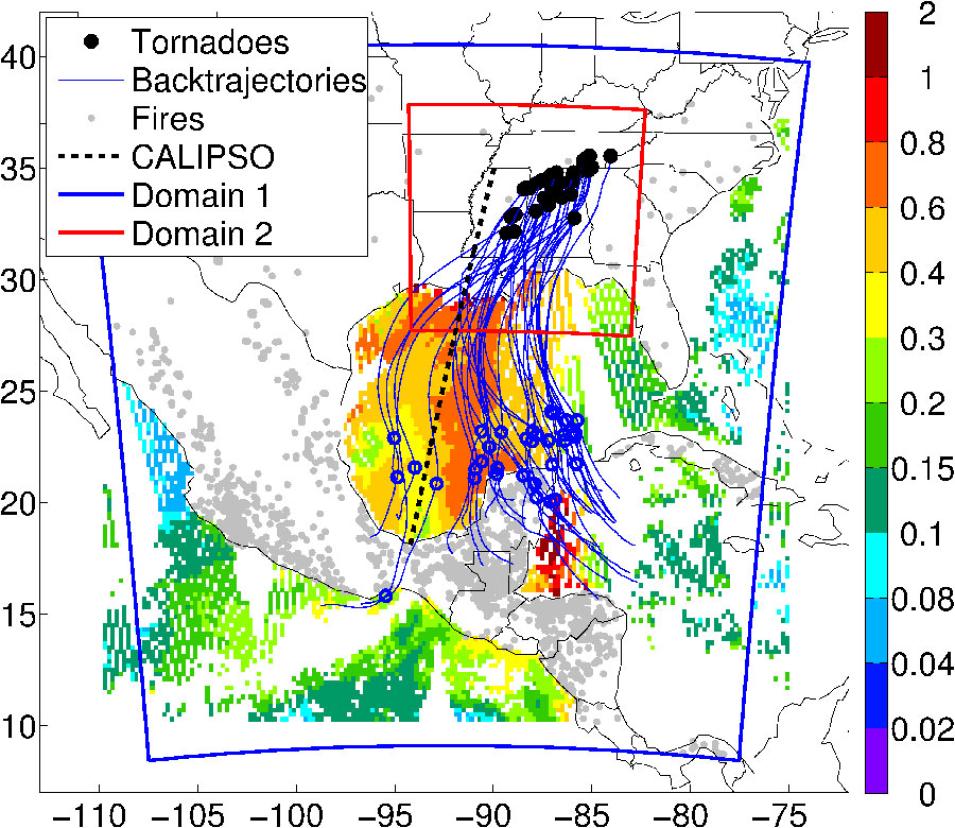
Data image showing smoke drifting from the Yucatan Peninsula correlating with a deadly tornado outbreak across the southeastern U.S.
This plot shows smoke in the atmosphere before and during the deadly tornado outbreak of April 27, 2011. Thin blue lines trace the flow of smoke from the Yucatán towards the southeastern United States, where black dots indicate clusters of violent EF4 and EF5 tornadoes. Blue circles show where the aerosols were first observed over the ocean on April 27; the color scale on the right side indicates aerosol concentrations as particles were dispersed through the atmosphere. Fires are shown as light grey dots. The line of small black dots running from Mexico to Mississippi reveals the path of the Cloud-Aerosol Lidar and Infrared Pathfinder Satellite Observations (CALIPSO) satellite as it passed over the area collecting smoke plume heights. (Courtesy P. Saide)

Forecast models that the National Weather Service (NWS) uses to predict severe weather cannot spot tornadoes. Instead of focusing on smaller regions where tornadoes form, these models keep tabs on the entire continent. To get around this limitation, Saide and his team looked for weather that accompanies tornadoes, the same conditions used in tornado forecasts. Low clouds blanketing the sky and a lot of low altitude wind shear are often spotted before strong tornado outbreaks, for instance.

Next, they fed the smoke data through a weather forecast model that also forecasts air quality by accounting for particles and gases. “The cool thing about this model is that it can represent interactions between aerosols and weather,” Saide said. They ran simulations, with and without smoke, to see if smoke and soot were affecting the conditions where tornadoes formed. Indeed they were and for the first time they could see how.

Slow and low

Saide said, “It was hard to convince people this is actually happening.” How clouds and sunlight interact with aerosols is still a big question in climate science. But no previous study had looked at the same conditions used to predict tornadoes. By doing so, the team found that smoke affects precisely where, when, and how much energy is released as tornadoes. The air masses carrying smoke and soot aerosols reflect heat more efficiently, and that causes the temperature difference between the front air masses to be much sharper.

Scott Spak, a researcher at the University of Iowa, said, “We found that smoke causes the tornadoes to wait just a little longer until the situation becomes just a little more unstable.” That waiting creates a lower cloud base. It in turn changes the difference in wind between the surface and the cloud level from which tornadoes come down.

Like winding up a spring, that lower cloud base traps even more spinning wind beneath it. “You’re compressing the building of energy,” Spak said, “and the fact that there’s more wind shear means you have more likelihood of forming a twister rather than just different wind at different levels.” The result is a lot of power waiting to be unleashed.

Image
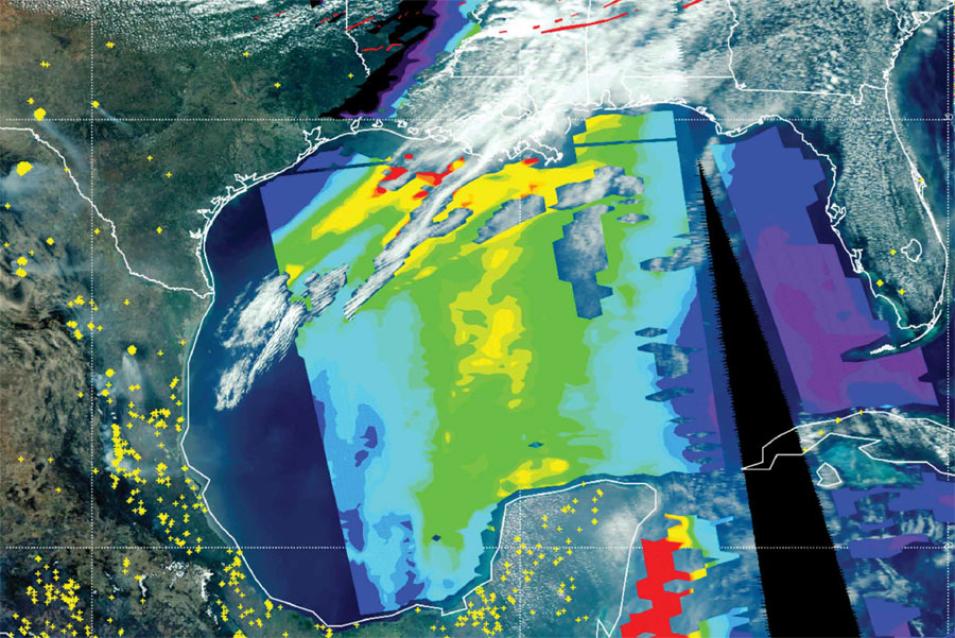
Data image showing smoke from the Yucatan Peninsula wafting up across the southeastern U.S.
This image shows conditions captured by the Moderate Resolution Imaging Spectroradiometer (MODIS) instrument on the Aqua satellite on April 27, 2011 over the southeastern United States, Central America, and the Gulf of Mexico. Tornado tracks from local reports for April 26 to 28, 2011 were obtained by the National Oceanic and Atmospheric Administration (NOAA) Storm Prediction Center and are shown as red lines (upper right). The background is a true color image of clouds and smoke, with yellow showing fire emissions, and with a cloudy overlay showing aerosol optical depth (AOD). Red, green, and purple indicate high (1.0), medium (0.6), and low (0.1) AOD values. (Courtesy B. Pierce, NOAA NESDIS STAR)

Smoke and forecasting

These findings have explained how smoke can play a role in forming tornadoes, and are novel in that they were the first to come from a real-world case study, but Saide cautions that it is just one study. He is repeating this exercise for multiple outbreaks over multiple years to see if the results are similar to those of the April 27, 2011 outbreak.

Saide said, “We get at this tornado likelihood kind of indirectly by using environmental conditions.” Their plan is to run the model at a higher resolution to capture conditions directly. “If we continue to find that these interactions are important, we need to add aerosol interactions to weather forecasting,” he said.

For timely results, weather prediction models need to run in hours, however, and the team’s current model takes days. Finding simpler aerosol models that still yield good results is a big priority.

“What I find really exciting is that we’re starting to understand just how important such tiny particles can be,” Saide said.

References

NASA Atmospheric Science Data Center (ASDC). 2011. CALIOP Level 3 Aerosol Profile. Hampton, VA, USA. doi:10.5067/CALIOP/CALIPSO/CAL_LID_L3_APro_CloudFree-Standard-V3-00.

NASA Land Processes DAAC (LP DAAC). 2011. MOD14. USGS/Earth Resources Observation and Science (EROS) Center, Sioux Falls, SD. https://lpdaac.usgs.gov/dataset_discovery/modis/modis_products_table/mod14.

NASA Land Processes DAAC (LP DAAC). 2011. MYD14. USGS/Earth Resources Observation and Science (EROS) Center, Sioux Falls, SD. https://lpdaac.usgs.gov/dataset_discovery/modis/modis_products_table/myd14.

NASA Level 1 and Atmosphere Archive and Distribution System (LAADS) DAAC. 2011. MOD06_L2, MOD03, and MYD03. Greenbelt, MD, USA. https://ladsweb.nascom.nasa.gov/search/.

Saide, P. E., S. N. Spak, R. B. Pierce, J. A. Otkin, T. K. Schaack, A. K. Heidinger, A. M. daSilva, M. Kacenelenbogen, J. Redemann, and G. R. Carmichael. 2015. Central American biomass burning smoke can increase tornado severity in the U.S. Geophysical Research Letters 42: 956–965. doi:10.1002/2014GL062826.

For more information

NASA Atmospheric Science Data Center (ASDC)

NASA Land Processes Distributed Active Archive Center (LP DAAC)

NASA Level 1 and Atmosphere Archive and Distribution System DAAC (LAADS DAAC)

About the remote sensing data
Satellites Terra and Aqua Terra and Aqua Cloud-Aerosol Lidar and Infrared Pathfinder Satellite Observation (CALIPSO)
Sensors Moderate Resolution Imaging Spectroradiometer (MODIS) MODIS Cloud-Aerosol Lidar with Orthogonal Polarization (CALIOP), Imaging Infrared Radiometer (IIR), Wide Field Camera (WFC)
Data sets Aerosol Product (MYD04), Cloud Product (MOD06_L2), Geolocation Fields (MOD03, MYD03) Thermal Anomalies and Fire (MOD14 and MYD14) CALIOP Level 3 Aerosol Profile
Resolution 1 kilometer 1 kilometer 0.1 degree
Parameters Aerosol optical depth, cloud optical depth, geolocation data Fires and biomass burning Plume heights
DAACs NASA Level 1 and Atmosphere Archive and Distribution System Distributed Active Archive Center (LAADS DAAC) NASA Land Processes DAAC (LP DAAC) NASA Atmospheric Science Data Center (ASDC)
 
Last Updated