This tutorial guides users in working with Landsat 8 Operational Land Imager (OLI) surface reflectance data (band combination 5, 4, 3) from the Analysis Ready Data Collection 2 using the Application for Extracting and Exploring Analysis Ready Samples (AppEEARS) tool. It models methods for extracting data, submitting a data request for an area of interest, and accessing data visualizations for the purposes of evaluating vegetation. This tutorial focuses on data access and does not address how to analyze surface reflectance data.
To download data for a point of interest, instead of area, see the related tutorial Access Landsat 8 Surface Reflectance Point Data with AppEEARS.
Context
This tutorial provides step-by-step instructions to access Landsat Surface Reflectance values for an area of interest (polygon) with the purpose of evaluating vegetation, focusing on data access in GeoTIFF file formats for green spaces around Temple University. It does not address how to analyze surface reflectance data. These instructions can be used to validate in-situ data, compare imagery from NASA Worldview, and more.
Objectives
- Access data and practice using the AppEEARS Interface
- Extract Landsat data in bands 5-4-3 from AppEEARS for an area of interest
- Submit a request for Landsat 8 data through AppEEARS
- Access visualizations of Landsat 8 surface reflectance data in AppEEARS
Data Action
- Temporal Subset
- Spatial Subset
- Spectral Subset
- Download
Procedure
Get Started
- Navigate to the AppEEARS tool.
- Click the Sign In button at the top right of the page.
- Enter user's Earthdata Login information.
Explore AppEEARS
- At the top of the screen users will see the options to Extract, Explore, or get Help.
- Select the Extract dropdown, which presents users with the options to get the data by area or point.
Create an Area Request
To extract area samples, follow the instructions below.
- From the AppEEARS menu, click the Extract dropdown option and then click Area.
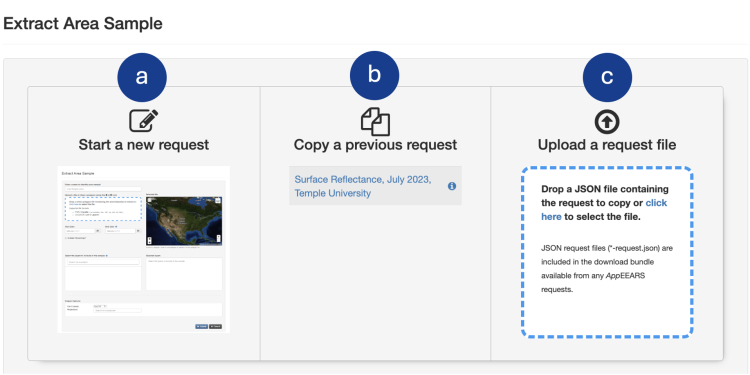
In the Extract Area Sample box, users have three choices:
(a) Start a new request – start a new request for a new area and new time period.
(b) Copy a previous request – Reprocess or edit parameters of an existing sample with new information.
(c) Upload a request file – upload a JSON file to populate a new sample with the input parameters from any previous sample request. JSON files are included in the download bundle for completed requests.- In this example we will select Start a new request. Click on the picture in the menu or the link to initiate.
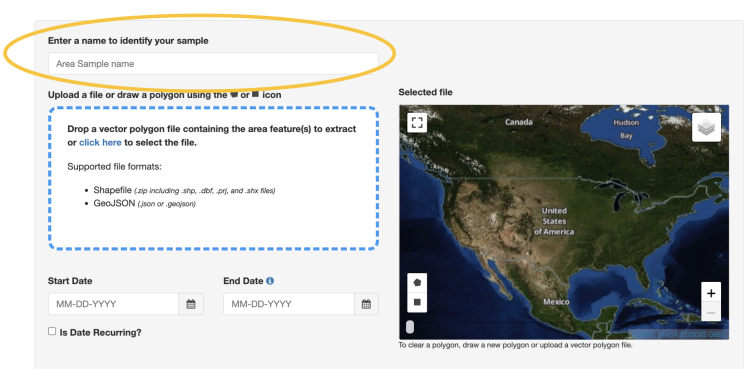
4. Enter a name for the sample in the box (e.g., “ex. Surface Reflectance, July 2023, Temple University”).
Input Spatial Requirements
Users can define the region of interest in two ways:
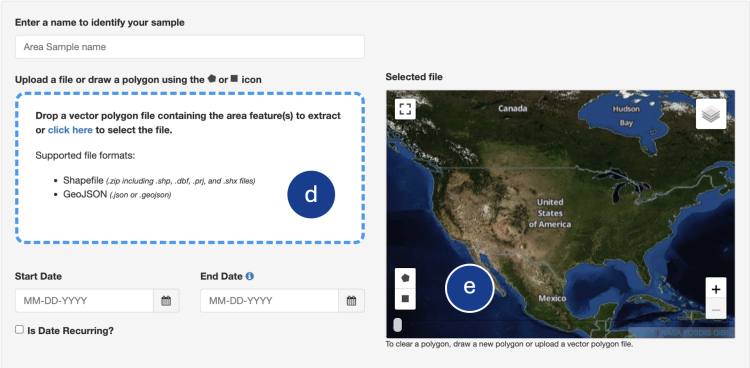
- Upload a vector polygon file in shapefile format (users can upload a single file with multiple features or multipart single features). The .shp, .shx, .dbf, and .prj files must be zipped into a file folder to upload. Or: Upload a vector polygon file in GeoJSON format. A single file with multiple features or multipart single features can be uploaded.
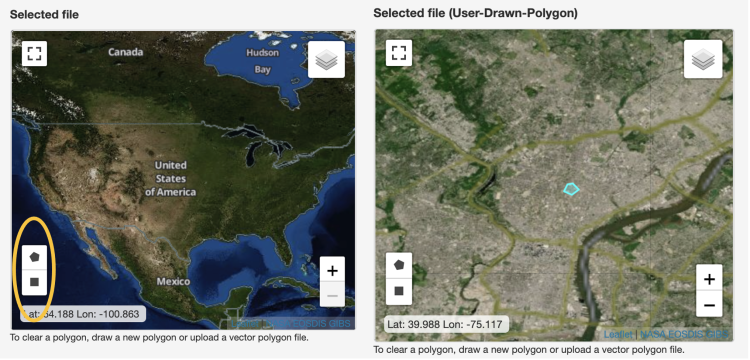
- Draw a polygon on the map by clicking on the bounding box or polygon icons (single feature only).
For the purposes of this tutorial, select the second option. In the map box, zoom to the desired geographic area of interest (AOI), Temple University, by using the + symbol or by double clicking in the AOI.
Note: If users need help finding Temple University from this map view, visit Google Maps to become familiar with its estimated location.
- Click on the polygon (the pentagon - not the bounding box square) on the map interface and draw a polygon over Temple University, Philadelphia, Pennsylvania in the map box.
- Click on the map to add each vertex. Click on the first position to close the shape. It will appear as a highlighted shape over the area selected.
- To redo the shape, simply start drawing a new polygon and this will erase the current one.
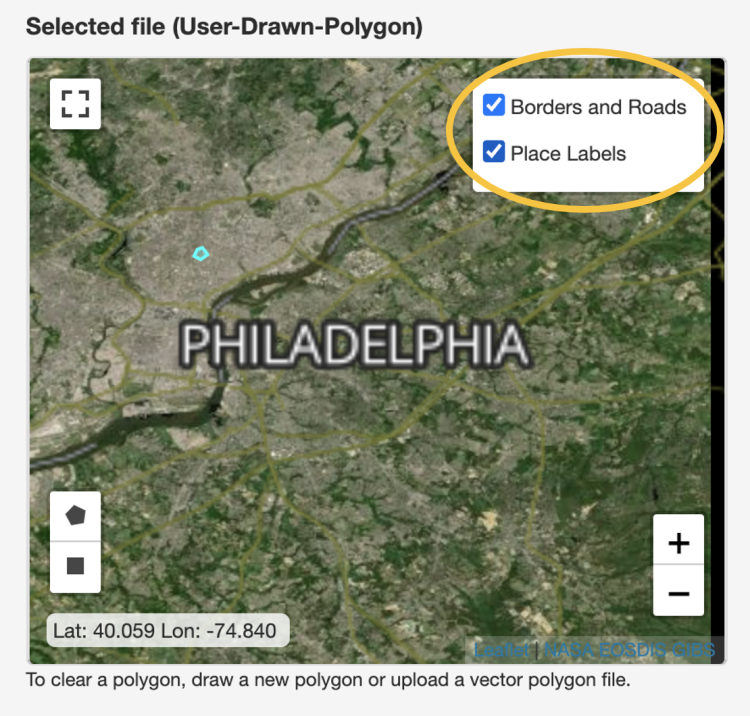
- Users can change the visible layers by clicking on the icon in the upper right-hand corner of the map box.
If the place labels, borders, or roads interfere with the view of the map, turn them off by hovering over the layers icon in the top right corner of the map box and deselecting the options.
Input Date Requirements
- Input the date range by entering a Start Date and End Date (MM-DD-YYYY) or by clicking on the Calendar icon and selecting dates in the calendar. If the date range is recurring, select the checkbox, identify a date range (MM-DD) and then specify the year range using the slider.
- Input the Start and End Date for month of interest: 07/01/2023 to 07/31/2023.
Input Dataset Requirements
AppEEARS offers access to a variety of mission data products.
To find a dataset start to type the desired satellite, instrument, or parameter in the layers box. Suggestions will populate in a dropdown menu, select the desired data collection.
Clicking the + symbol next to the layer names, in the area below, will add data to the Selected layers pane. Layers from multiple products can be added to a single request.
1. In the "Select the layers to include in the sample" input box, type the phrase “Surface reflectance”. Suggestions will populate in a dropdown menu and users may select all or individual items.
2. For purposes of this tutorial, scroll down to the Landsat Analysis Ready Data (ARD) surface reflectance data products.
- Currently, AppEEARS contains the following Landsat data products: Analysis Ready Data (ARD) and Harmonized Landsat and Sentinel-2 (HLSL30). For more information about these data products, visit the Background section below.
To learn more about the data products available in AppEEARS, access the list of all products by:
- Selecting the Information icon "i" next to "Select the Layers to include in the sample" or
- Return to the top navigation and select Help, then select Available Products.
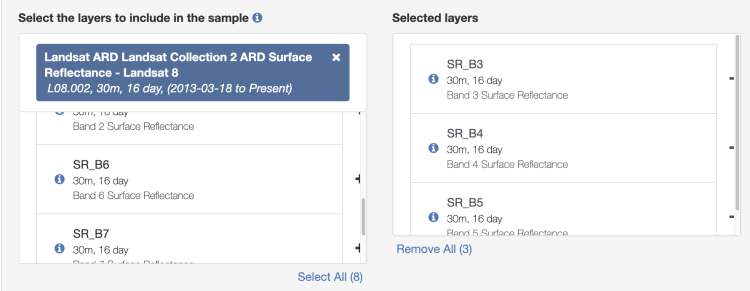
3. Select Landsat ARD Landsat Collection 2 ARD Surface Reflectance - Landsat 8 L08.002, 30m, 16 Day, (2013-03-18 to Present) to add to the Selected layers list. Click the layer(s) from which you would like to extract data.
- Scroll until the following options appear. Add the bands 5-4-3 by clicking on the + sign to add each layer into the cart.
- SR_B5 (L08.002)
- SR_B4 (L08.002)
- SR_B3 (L08.002)
- The selected layers will appear in the Selected layers box. For more information on a specific layer, click on the Information icon "i" next to a layer name.
Add the following datasets:
- SR_B5 (L08.002)
- SR_B4 (L08.002)
- SR_B3 (L08.002)
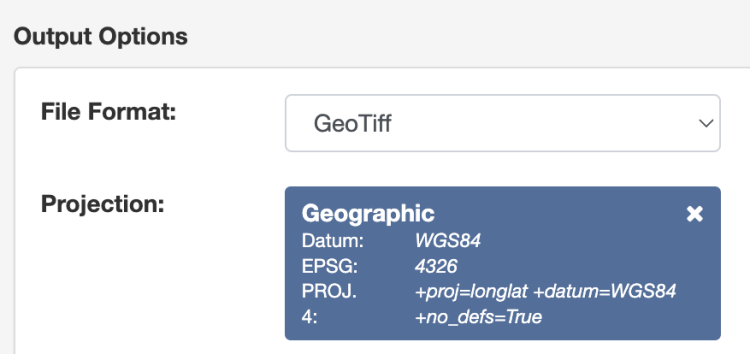
4. There are two output file formats available in the Output Options section. Select GeoTIFF for File Format for this tutorial.
- Georeferenced Tagged Image File Format (GeoTIFF) is based on the TIFF format and is used as an interchange format for georeferenced raster imagery. GeoTIFF is in wide use in NASA Earth science data systems. If GeoTIFF is selected, one GeoTIFF will be created for each feature in the input vector polygon file for each layer by observation.
- Network Common Data Form version 4 (NetCDF-4): when this format is selected, outputs will be grouped into .nc files by product and by feature.
5. There are multiple projections available. Select Geographic for Projection.
The interface will display specific information about each coordinate reference system. This information includes the Datum, the European Petroleum Survey Group (EPSG) code, and PROJ.4 string used for the transformation.
6. Click the Submit button on the bottom left of the Extract Area Sample Box.
- Once the request has been submitted, users will see a banner if the request is successful. Note: If the request was not successfully submitted, a red banner will appear explaining why the request failed.
Once the request is submitted, users can check on the status of that request in Explore Requests. As soon as the request is submitted and received it will be queued; when the request begins processing it will show a progress bar.
Click the Information icon "i" in the Details column to view details about the request. The percentage bar under the Status column indicates that the request is processing and the overall progress in completing the request.
Manage, Explore, and Download the Results
Look for an email with the subject line “AppEEARS Request Complete.” Be sure to check the Junk Mail folders and mark the email as "Not Junk" if possible.
The email will link to the area sample download zip file, as well as supporting files and data visualizations.
View and Interact with the Results
At any given time, users may log into AppEEARS with their Earthdata Login and access the Explore Requests page.
Users have access to different visualizations to explore their retrieved data; these depend upon the type of extraction selected. (Note: these are not publication-quality visualizations but are available for quick insights before downloading data.)
Click the Chart icon to view and interact with the results.
- Click on the Request dropdown option at the top of the page to view the sample extraction details (e.g., Date Range, Product/Layers, Point Coordinates, and Request ID).
Download the Data
- Select the Download Icon to download the results (.zip). There are a couple of ways to download the data:
- Visit the Explore Screen, click on the specific request, then select the dropdown for the Request to View Area Sample. Click the Download button to get to Download Area Sample page.
- Or visit the Explore navigation and under Explore Requests, select the download icon for the specific request.
- The Download Area Sample page contains two sections:
- Supporting Files -Supporting files include text files of the input granules used to complete a request and a readme file. A JSON file that can be used to generate the exact same parameters for a new request and CSV files that provide associated data quality information are also included. Click on any of the file names to download them.
- The sample request outputs GeoTIFF or NetCDF-4 files.
Resources and References
Data: Landsat 8 OLI
The Landsat 8 Operational Land Imager (OLI) captures data across 11 bands, each measuring a specific range of wavelengths on the electromagnetic spectrum. To see the breakdown of bands, their wavelengths, and common applications, visit the Landsat 8 Band Characteristics section. Depending on the specific application, different combinations of bands and additional processing techniques may be used to extract the desired information from Landsat 8 data.
Landsat Data Products available in AppEEARS
Landsat Product | Description | DOI |
|---|---|---|
Analysis Ready Data (ARD) |
| 10.5066/P960F8OC |
Harmonized Landsat and Sentinel-2 (HLSL30) |
|
Landsat 8 Band Characteristics and Uses
*Of its 11 bands, only those in the very shortest wavelengths (bands 1–4 and 8) sense visible light – all the others are in parts of the spectrum that we can’t see.
Band | Wavelength (μm) | Description | Common Uses of this Band | Spatial Resolution |
|---|---|---|---|---|
Coastal Aerosol (1)* | 0.43 - 0.45 | Deep Blues and Violets | Coastal studies, aerosol detection | 30 m |
Blue (2)* | 0.450 - 0.51 | Blue Light | Water quality, vegetation analysis, bathymetric mapping, identifying soil from vegetation | 30 m |
Green (3)* | 0.53 - 0.59 | Green Light | Vegetation health, land cover classification, plant vigor | 30 m |
Red (4)* | 0.64 - 0.67 | Red Light | Vegetation, vegetative slopes, natural color composites | 30 m |
Near-Infrared NIR (5) | 0.85 - 0.88 | Reflected Near-Infrared | Plant health assessment, biomass estimation, shorelines | 30 m |
Shortwave infrared SWIR 1 (6) | 1.57 - 1.65 | Short-Wave Infrared 1 | Vegetation moisture, soil moisture, penetrates (thin) clouds | 30 m |
Shortwave infrared SWIR 2 (7) | 2.11 - 2.29 | Short-Wave Infrared 2 | Mineral identification, geology, penetrates (thin) clouds | 30 m |
Panchromatic PAN (8)* | 0.50 - 0.68 | All Visible Colors (High Resolution) | Improved spatial resolution of other bands, creating detailed maps, sharper image definition | 15 m |
Cirrus (9) | 1.36 - 1.38 | Reflected Near-Infrared | Cirrus cloud detection | 30 m |
Thermal Infrared TIR (10) | 10.8 - 12.3 | Thermal Emittance (100m) | Land surface temperature, soil temperature | 100 m |
Thermal Infrared TIR (11) | 11.5 - 12.5 | Thermal Emittance (100m) | Land surface temperature, soil moisture | 100 m |
Common Landsat 8 Band Combinations
Band Combination | Name | Common Applications of this Band Combination Application |
|---|---|---|
4-3-2 | Natural Color Composite | “True” color visualization; simulates what human eyes “see”; may appear “hazy” due to atmospheric interference |
4-3-1 | Bathymetry | Estimating suspended sediment; useful in coastal bathymetric, and aerosol studies |
5-4-3 | Color Infrared (CIR)/ NIR False Color | Vegetation/Forest/Wetland health (highlight healthy vegetation (appears bright red); commonly used for measuring disturbed ground |
5-6-2 | Vegetation | Health |
5-6-4 | Water/Land | Water bodies, barren land, ice |
5-6-4 | Water/Land | Water bodies, barren land, ice |
5-7-1 | Air Quality/Bathymetry False Color | Track particulates, shallow water |
6-3-2 | Geology/False Color | Barren landscapes |
6-5-2 | Agriculture/False Color | Crop and vegetation; barren land |
6-5-4 | False Color (Vegetation) | Analysis |
7-5-2 | Forest Fire/False Color | Burn scars |
7-5-4 | Shortwave Infrared | Density of vegetation |
7-6-2 | Geology | Geological landforms, lithologic features, and faults |
7-6-4 | Shortwave Infrared/False Color (Urban) | Urban structure analysis; commonly used for identifying features like buildings and roads. |
References
Common Landsat Band Combinations. (2021, November 12). USGS.
Earth Resources Observation and Science (EROS) Center. (2021). Landsat 4-9 U.S. Analysis Ready Data, Collection 2 [dataset]. U.S. Geological Survey. doi:10.5066/P960F8OC
Forsythe, Jeremy D. GitHub - JeremyDForsythe/icecream-tutorials: Tutorials for Earth from Above: Env 329 Using NASA Satellite Data (ECOSTRESS) for Real-Time Environmental Monitoring. GitHub.
Landsat NASA. (2021, December 4). Landsat 8 Bands, Landsat Science. Landsat Science | a Joint NASA/USGS Earth Observation Program.
